
For the past year, I have been building a mathematical model and the summer break seems as good a time as any to publish some results. The model seeks to eliminate the factor car by only measuring drivers against their teammates.
How Does It Work?
I’ll make this short, since I plan on making a full length post about the methodology later. My model was inspired by the amazing “f1metrics model” and therefore shares a significant portion of its methodology.
Step 1 was to introduce a unified points system. P1 gets 10p, P2 gets 10p*0.72= 7.2p, P3 gets 7.2p*0.72= 5.18p …. etc. all the way to P20. Driver related DNFs are scored with 0p.
Then the 2 teammates get their points assigned for every race. Races where one driver has mechanical issues are excluded (or corrected if possible). Driver errors are also excluded (or corrected if possible). Now the points are tallied up and converted on an s-curve. The difference between the two values of the drivers is the performance difference between them.
If you do this with all drivers over a lot of seasons, you can get a pretty sturdy web of relative driver performances. I used the age and experience curves of the “f1metrics model”.
Season Ratings
Now that I have performance ratings for the drivers, I can get a value for the car/team in a season since
(points)=(driver performance)+(car performance)
and therefore
(car performance)=(points)-(driver performance)
The driver errors are then added back in, giving a new points total, and through
(points)-(car performance)=(driver performance)
I get the actual performance of the drivers in that season. The performance ratings are then translated back over the s-curve to give a “points per race rating” which goes from 0-10. That is then multiplied by 10 to get a neat driver score of 0-100.
As you can see, the major difference to the “f1metrics model” is the handling of driver errors. In my opinion this results in more accurate ratings as the amount of errors a driver makes can vary widely from season to season. Secondly, it has the advantage of untieing teammates in a season. A drivers rating won’t automatically get boosted just because his teammate is having a shocker.
At its core the model is assessing a drivers ability to score points. Simplified the drivers’ season ratings can then be understood as
(driver rating)=(driver pace)-(driver mistakes)
If you want to know more click on “>How Does It Work”. To help give some perspective for the ratings I made these tiers:
- S – above 89
- A – above 82
- B – above 73
- C – above 62
- D – above 50
- F – below 50
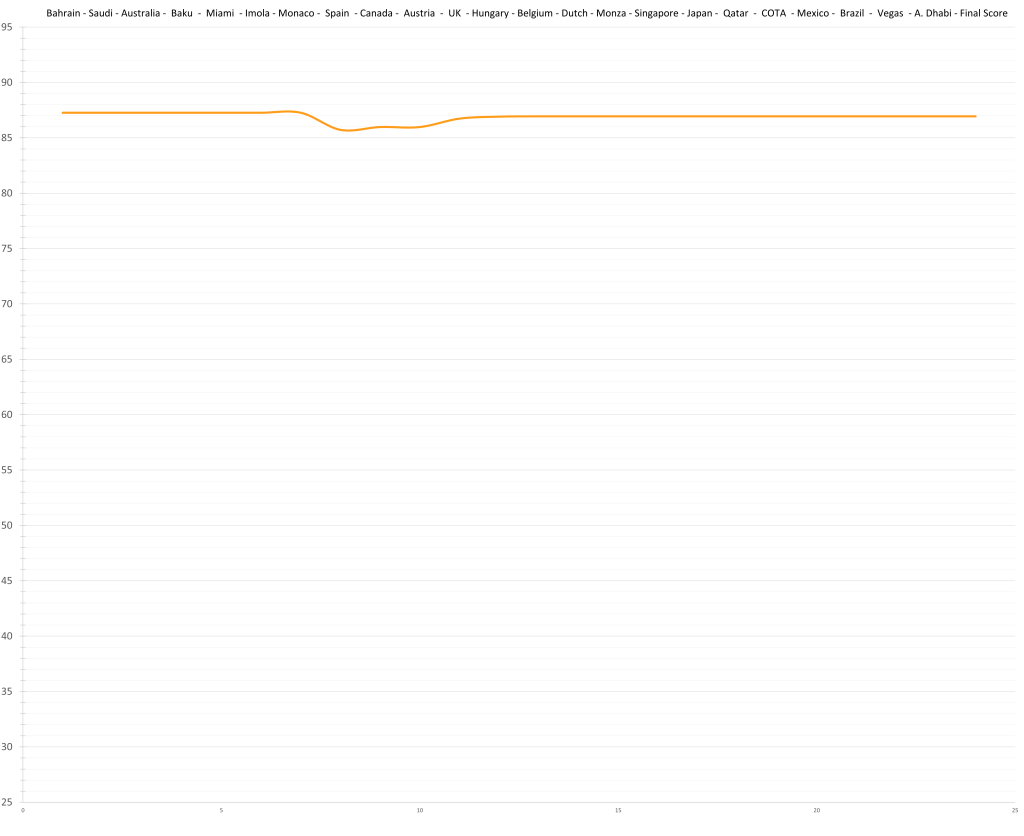
From going through all the data and seasons, I would say that generally a good season has a score above 73. Keep in mind, though, that there are no real cut lines. Another thing for perspective is that for the last 20 years the median performance slowly crept from around 60 towards 70. In 2021 it then jumped above 70 and has since stayed in the low/mid 70s.
Each driver has their own entry including a graph documenting the change of their season rating through the races, a short summary and of course the actual rating. Behind the rating (in parentheses) you’ll find the drivers expected baseline rating for the 2023 season. It roughly equates to pace and can be understood as a ceiling (only for this season since this value moves with age and experience). It gives you a better understanding and context for the actual driver rating in terms of underperformance, mistakes, consistency, speed etc.
The “Unworthy”
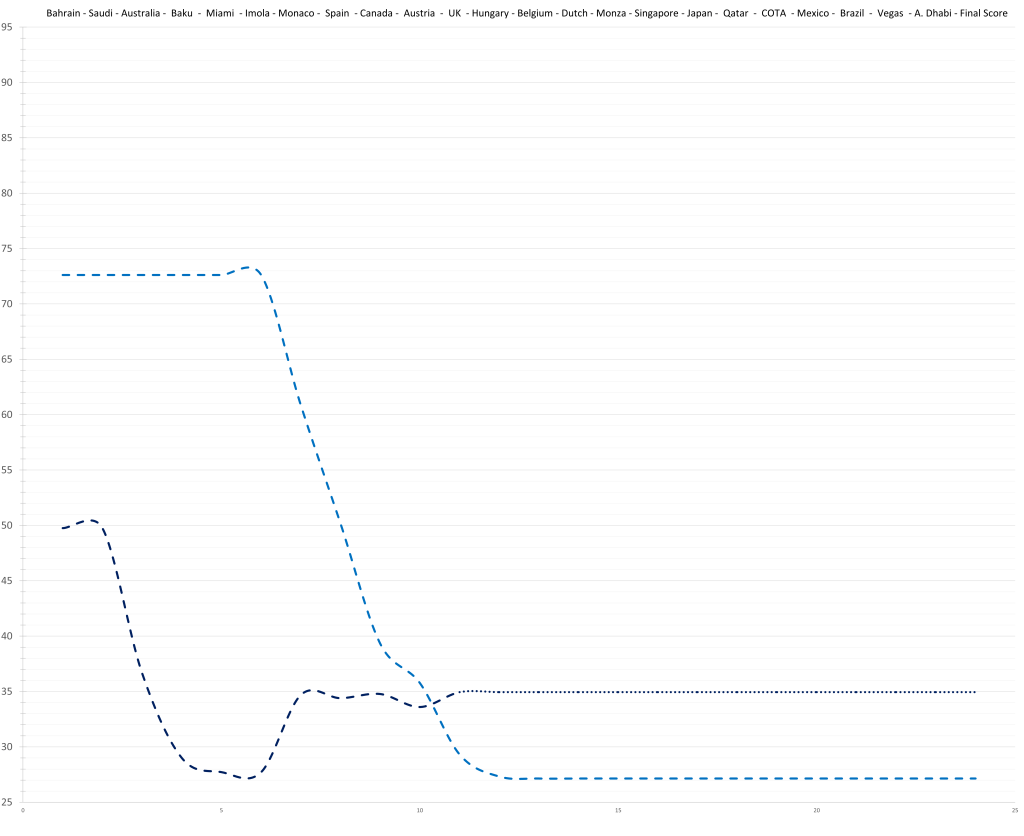
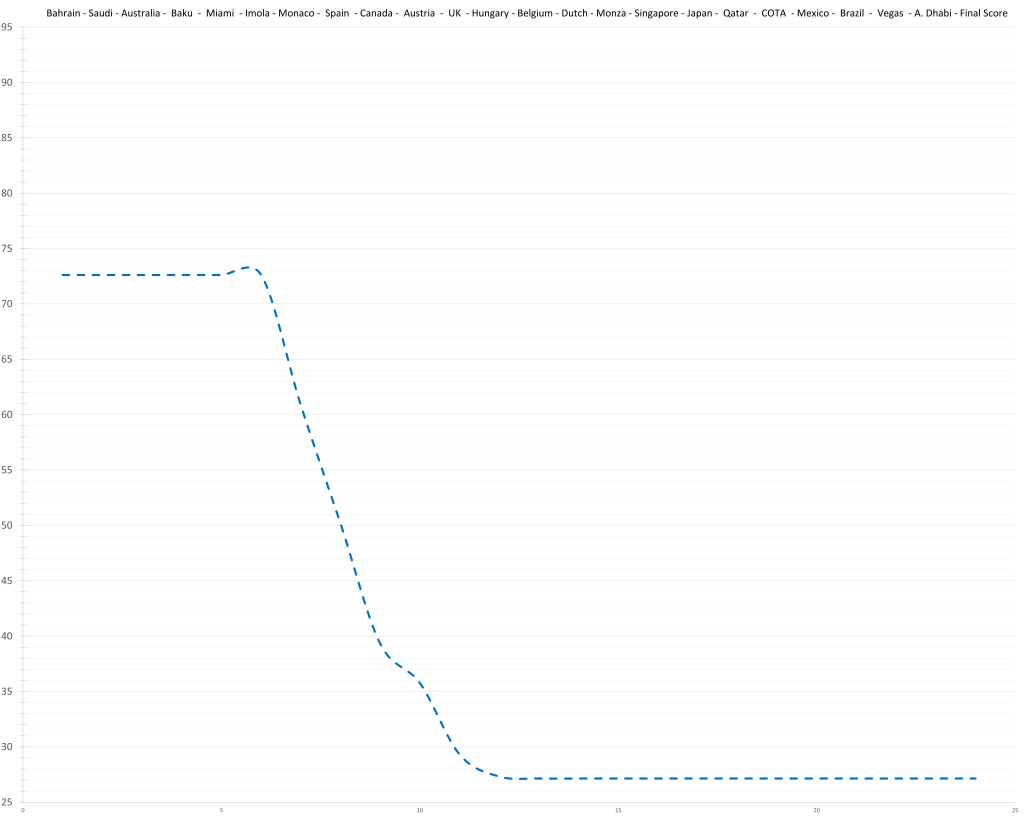
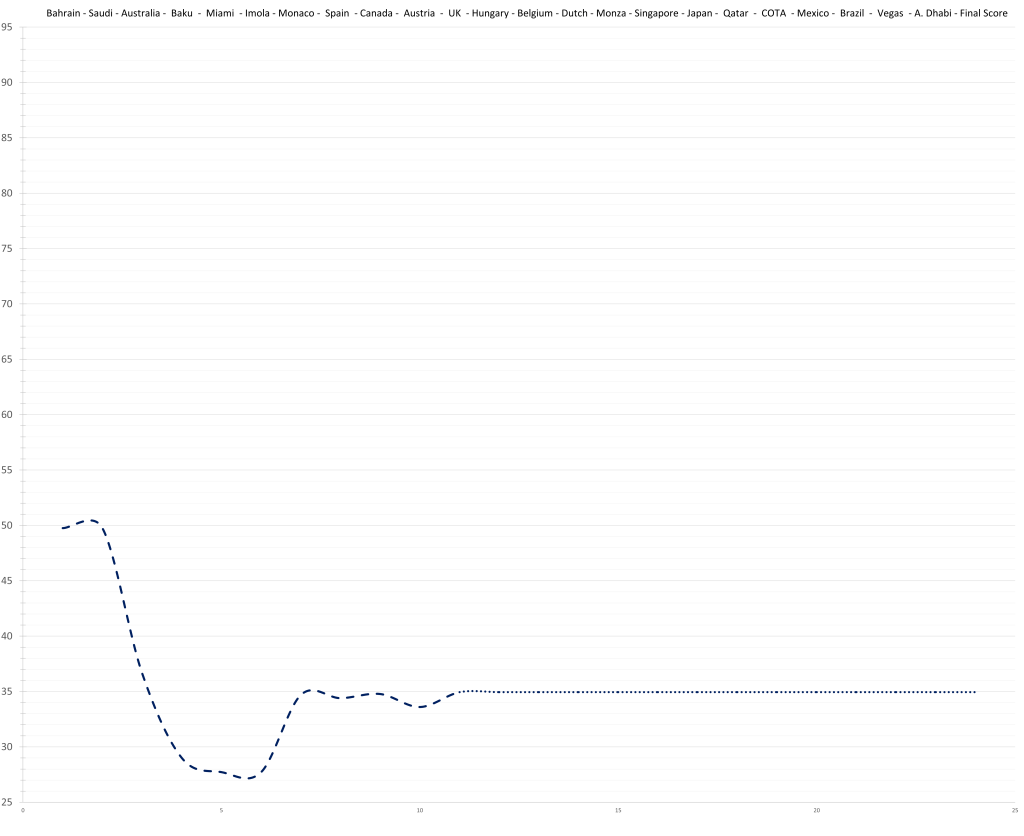
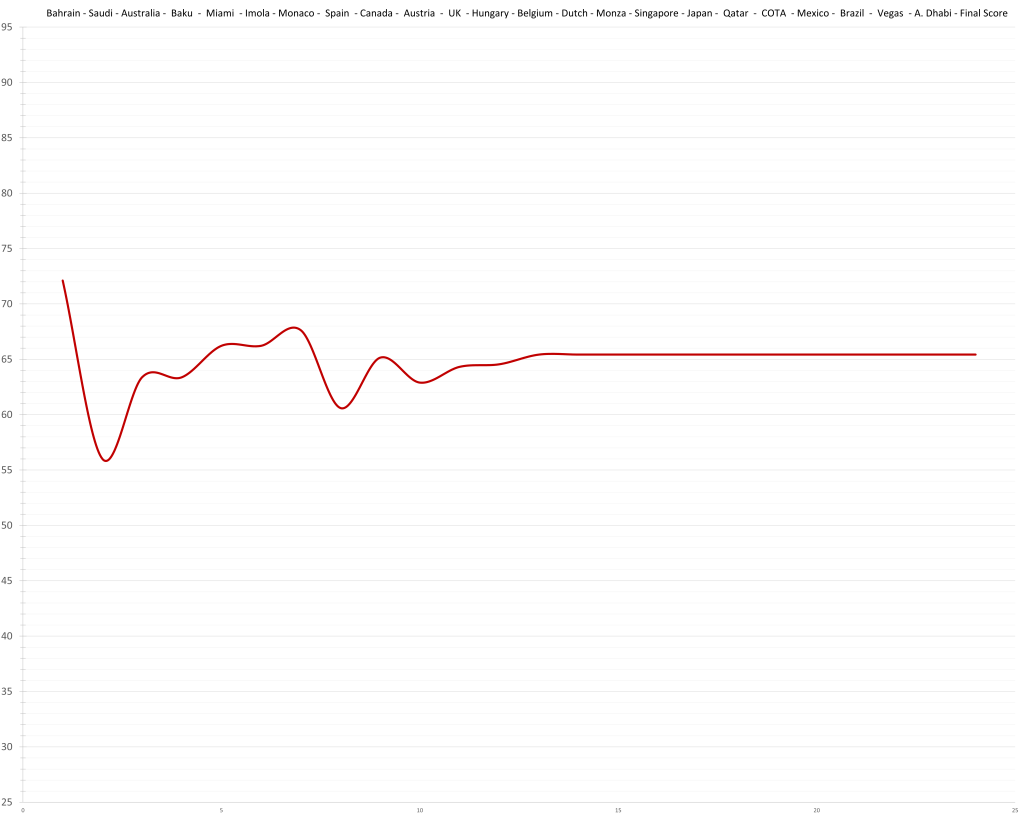
20 – Sergio Perez – 27.1 (72.6)
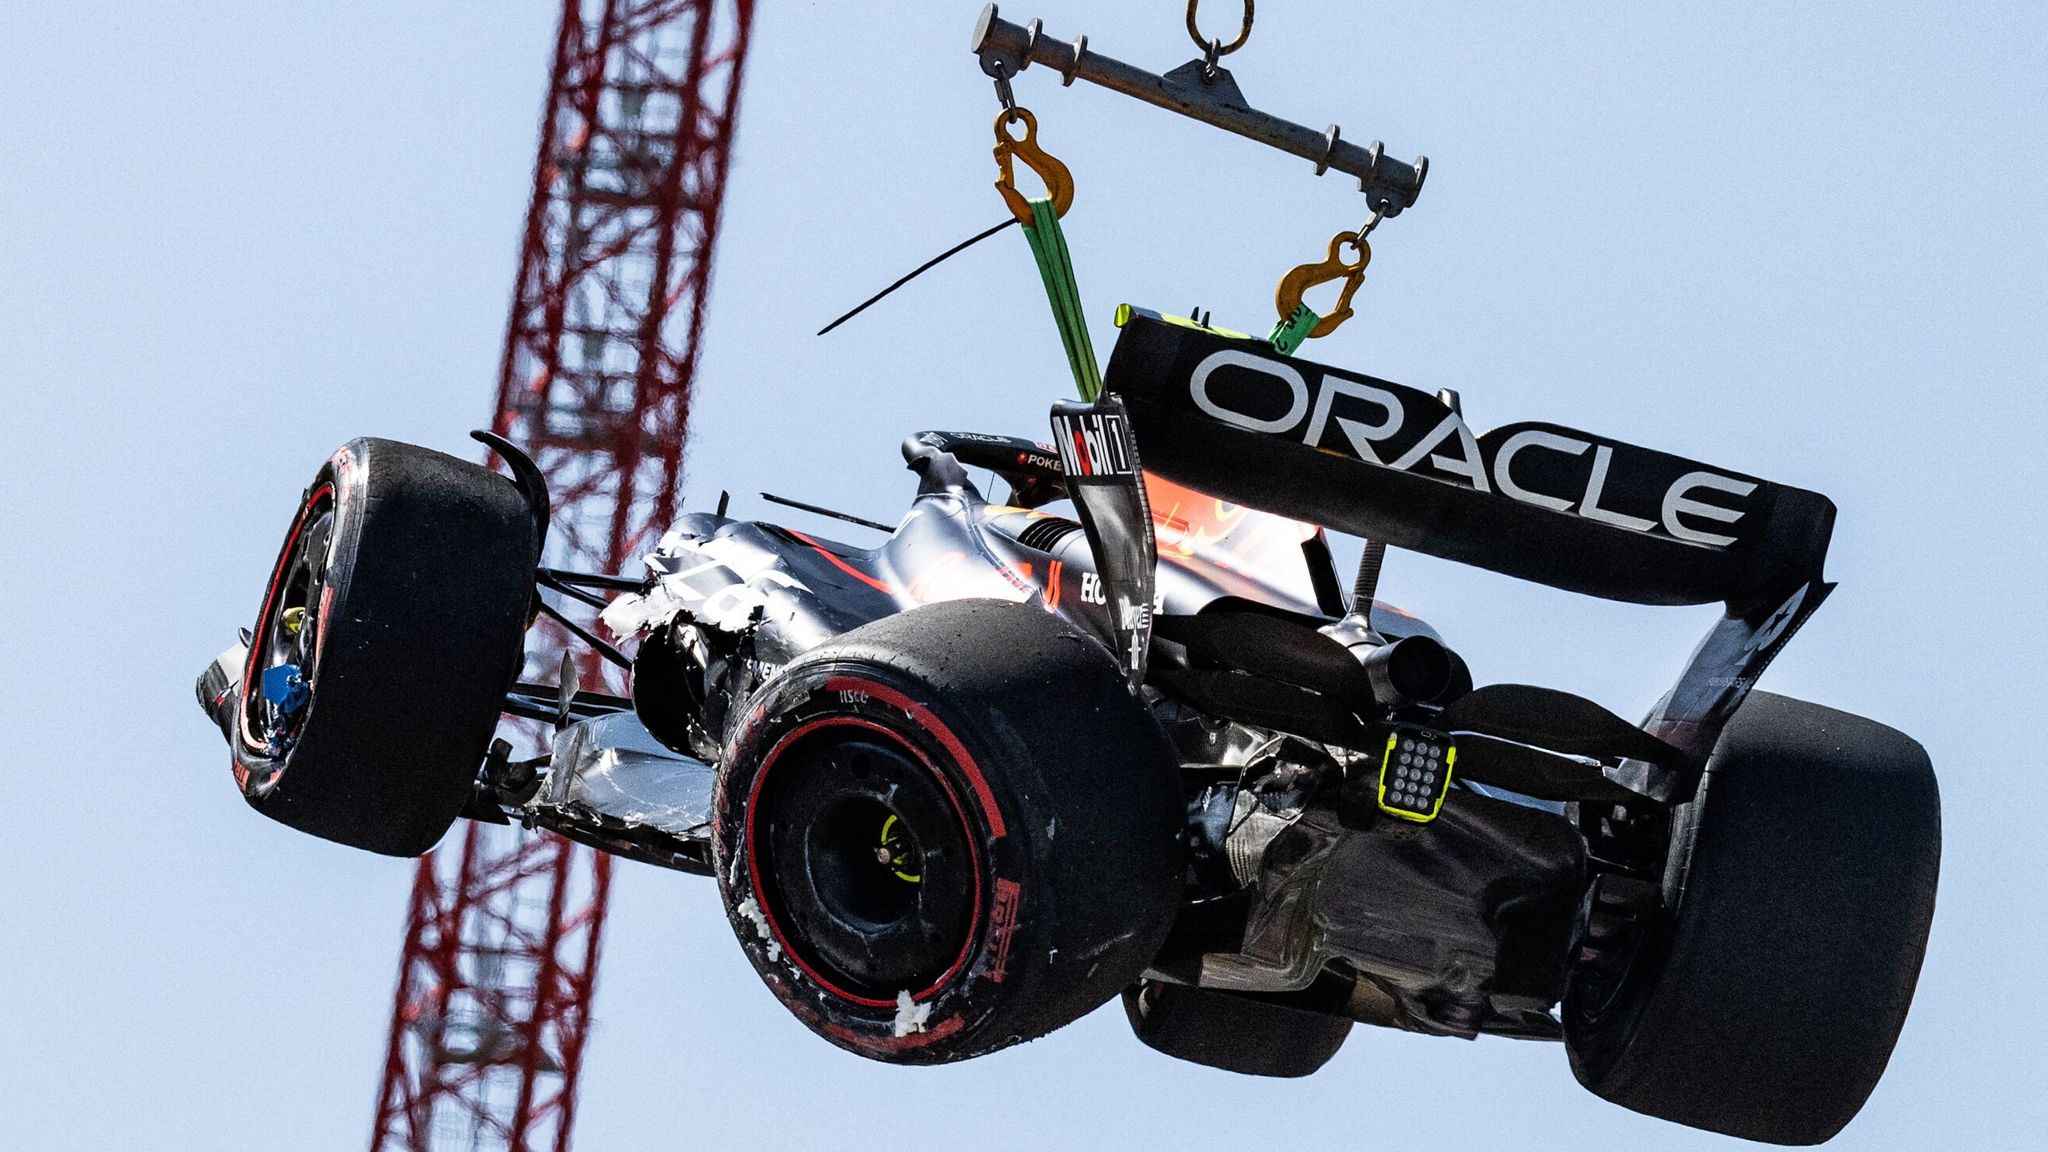
Unsurprisingly, Checo is having a horrible season. The Mexican is not rated very highly by the model anyway, naming him one of the slower drivers on the grid. Even a flawless Checo tops out as an average driver at around 72 (like at the beginning of the season). However, he was anything but flawless, having made mistake after mistake between Monaco and Silverstone. With a car that shouldn’t place lower than 2nd, this results in a lot of lost points which is ultimately what the model is based on.
19 – Nyck De Vries – 34.9 (46.9)

Like his season, I’ll cut this short. He didnt make it to the summer break for a good reason. The abysmal Alpha Tauri somewhat hides how poor he was since there wasn’t much to lose out on (unlike with Checo in the RB). The model sees him as a 47-ish level driver which is terrible. Even if you consider him to be like any other rookie, he would likely top out around 60, at which point age would already be a factor.
The “Barely OK Crowd”

18 – Lance Stroll – 52.3 (76.4)

Lance Stroll usually has good pace and destroys his ratings by making mistakes. Not this year, though. He has the potential to pull a 76 rating – or at least he should have, because in 2023 Lance has been completely off the pace (and is still making mistakes). The only reason I could think of are his wrists but that seems a little far fetched by now. We’ll see if he can improve in the second half of the season. For anyone thinking the model is overrating him in general: His rating is very well established against both Checo and Seb.
17 – Kevin Magnussen – 57.3 (67.4)

The batterer becomes the batter…ee? Something like that. At the moment it seems like Magnussen has no chance against Hulkenberg (at least in quali). While he is supposed to be worse than the Hulk according to the model, a big part of his rating is the crash in Melbourne which subsequently led to a 7th place finish for his teammate.
16 – Logan Sargeant – 60.3 (64.6)

An anonymous season. That is not too bad for a rookie. Logan Sargeant is doing fine. The model would predict him to become a solid driver like Ocon and Gasly but not exactly the next big thing. Sargeants whole rating is obviously hinging on Albon and Albon’s data is slim with only 2 half seasons worth against Verstappen, since 2020 is not very helpful due to his struggles.
15 – Zhou Guanyu – 60.6 (61.7)

Zhou is in his second year. He is not really impressive but also not too bad. Rookie Sargeant is already on his level in terms of pace and overall, according to the model.
The “Kinda Alright Group”
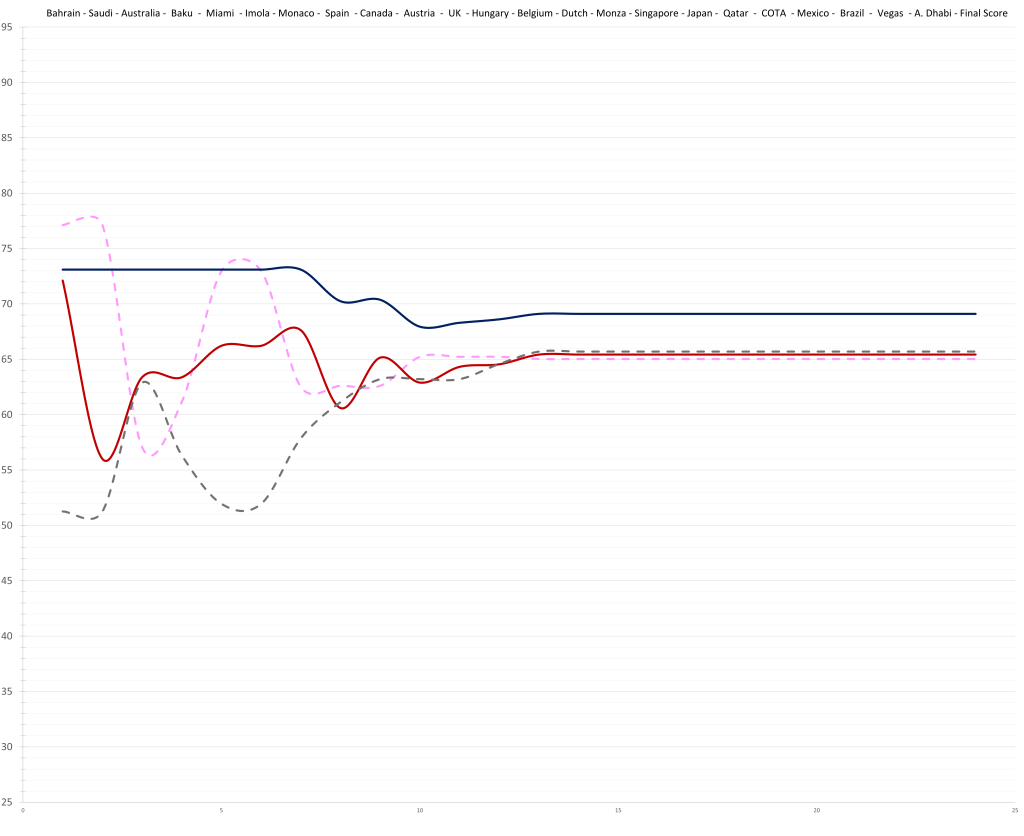
14 – Pierre Gasly – 65.0 (80.2)
Pierre Gasly’s inclusion this far down the list is unfortunate. The frenchman could be around 80 but on top of not being mistake free, he was also extremely unlucky with ruined quali laps and being taken out in good positions. To add insult to injury, Ocon managed a P3 in Monaco which inevitably looks bad for Gasly, as he couldn’t reproduce anything close, except for the Belgian Sprint. However, sprints are not included in the model. As I said: Unfortunate. I definetly expect him to be much higher up come end of the season.
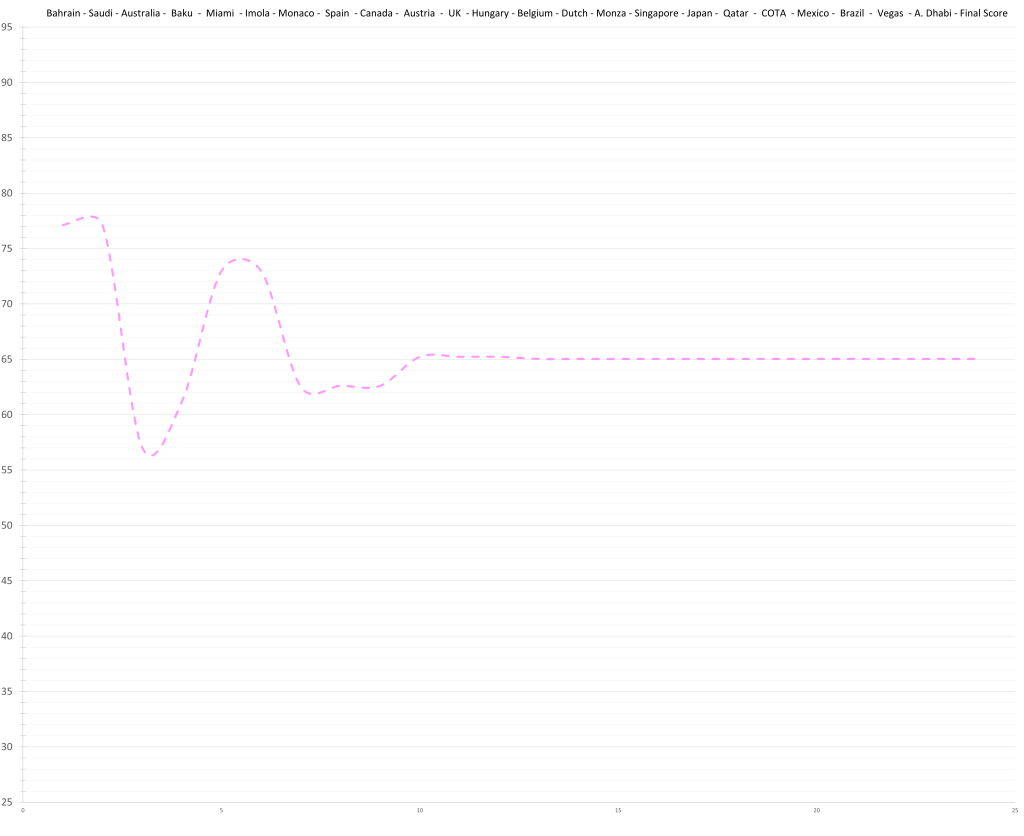
13 – Valtteri Bottas – 65.4 (72.1)
Valtteri Bottas might be the coolest driver on the grid. He is also very average. He and Hulkenberg are generally pretty similar. Both are way better in qualy than in the race and both had a similar peak level around 73. They also both have that one season where they looked like they could be more (2019 for Bottas) but in the end they both weren’t.
12 – Nico Hulkenberg – 65.7 (71.1)

Hulkenberg has been extremely impressive in qualifying. So much so that you sometimes wonder if there might be a top driver in him. But time and time again Nico has sadly proven that that is not the case. In his whole career he did not have a good season (i.e. above 73). 2018 might be an exception but it is more likely that Sainz simply underdelivered, rather than Hulk randomly reaching a different level for a season and then immediately falling back for 2019.

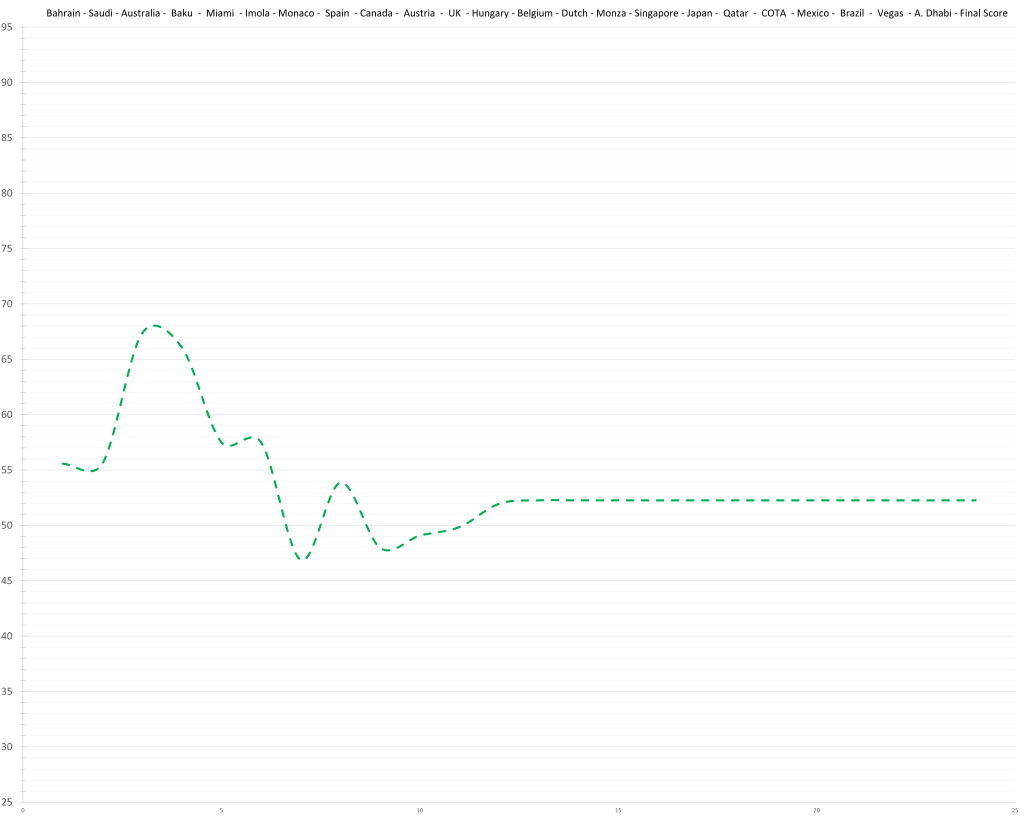
11 – Yuki Tsunoda – 69.1 (73.1)

Yuki’s general rating is not exactly rock solid. Therefore I am excited by his pairing with Danny for the second half of the season. Ricciardo, unlike Tsunoda and Gasly, is well established and tightly connected in the model. He will give more insights. Other than that, there is not much to say at this point about him. His teammate was a non-factor so far. If previous seasons are anything to go by, Yuki will lose a bit of ground being rather mistake prone.
The “Good Ones”
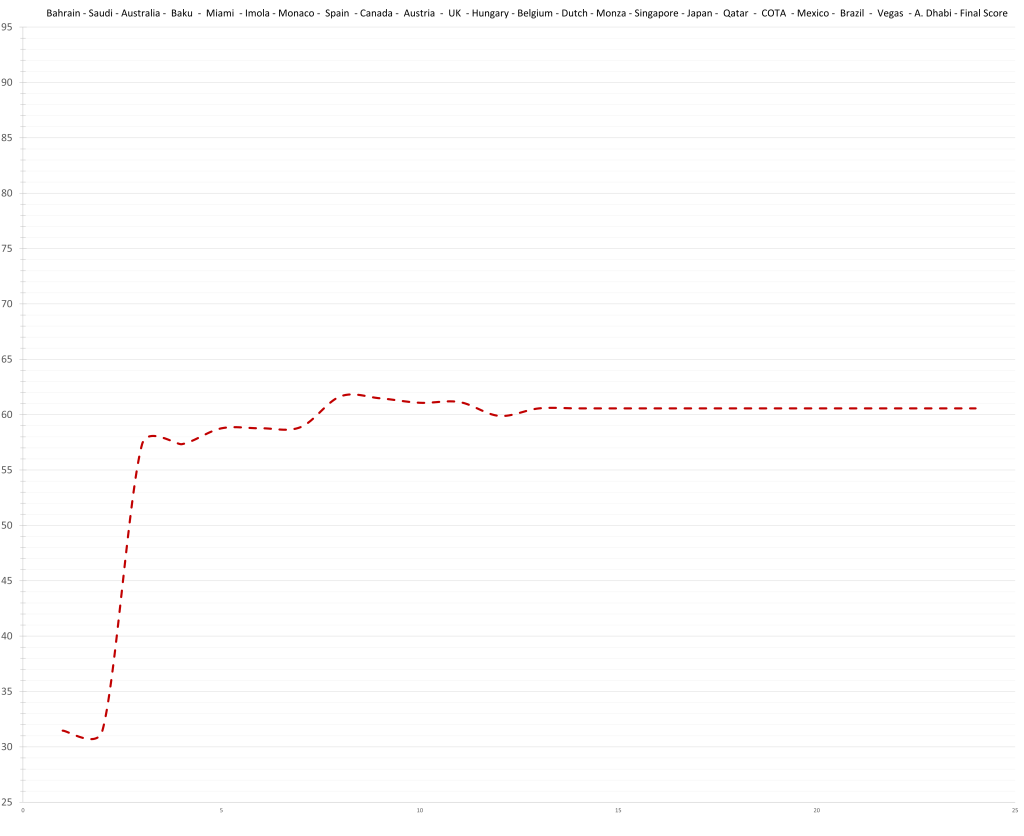
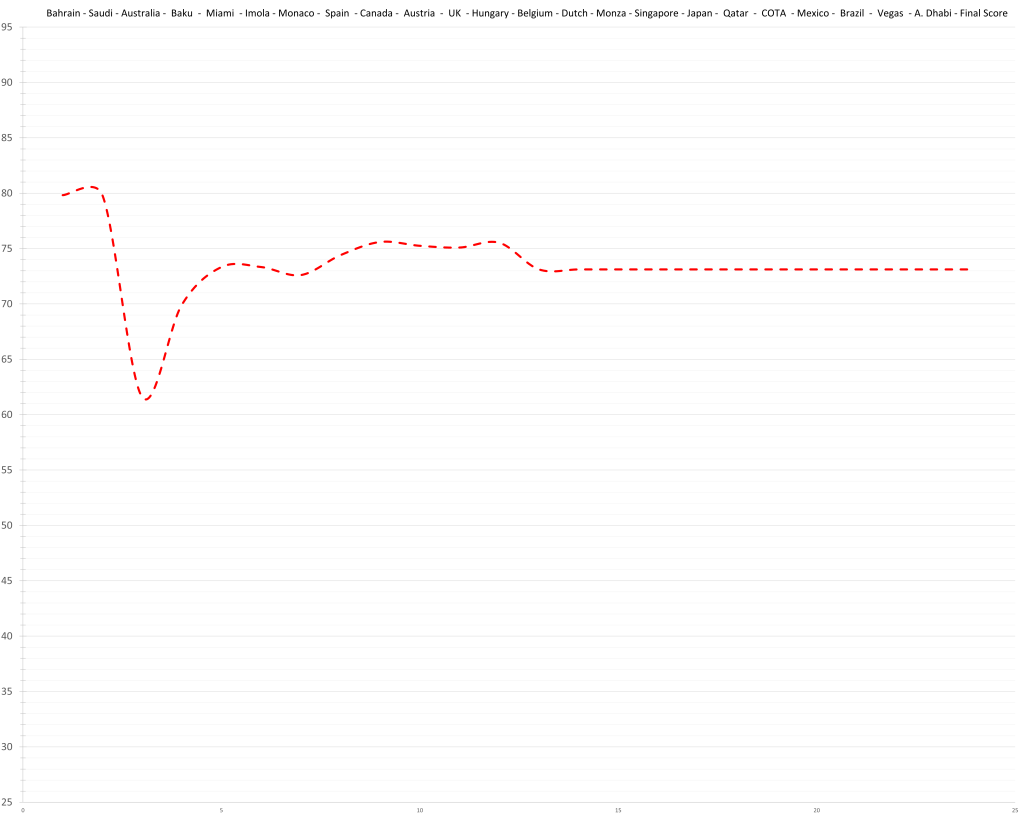
10 – Carlos Sainz – 73.1 (81.4)

The not so smooth operator might be close in points to Charles in the standings but my model thinks otherwise. In counting races he trails Charles 19-32 within the model. Usually Carlos Sainz is a really good driver, comparable to Button or Ricciardo, but the last 2 seasons have seen him slip back down the order due to mistakes. According to the model, he should have performed better at Austria and Silverstone. However the big blows to his rating are Australia and his first lap collision at Spa. Nonetheless, I expect him to climb in the second part of the season.
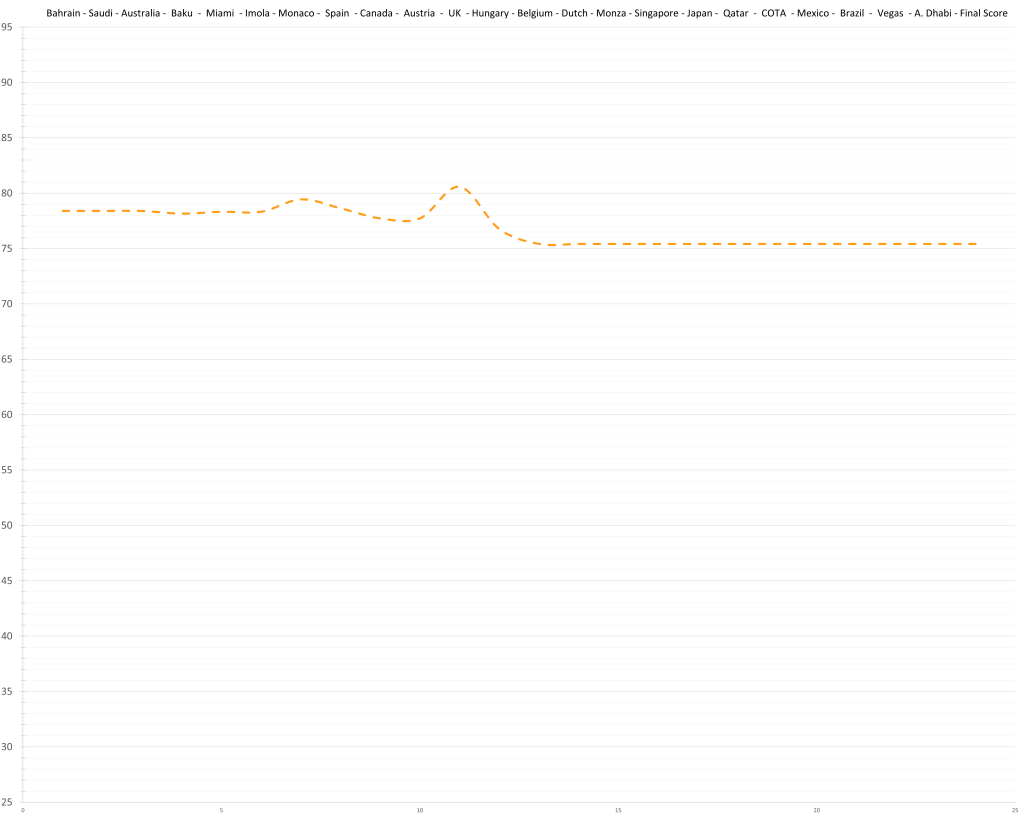
9 – Oscar Piastri – 75.4 (76.4)
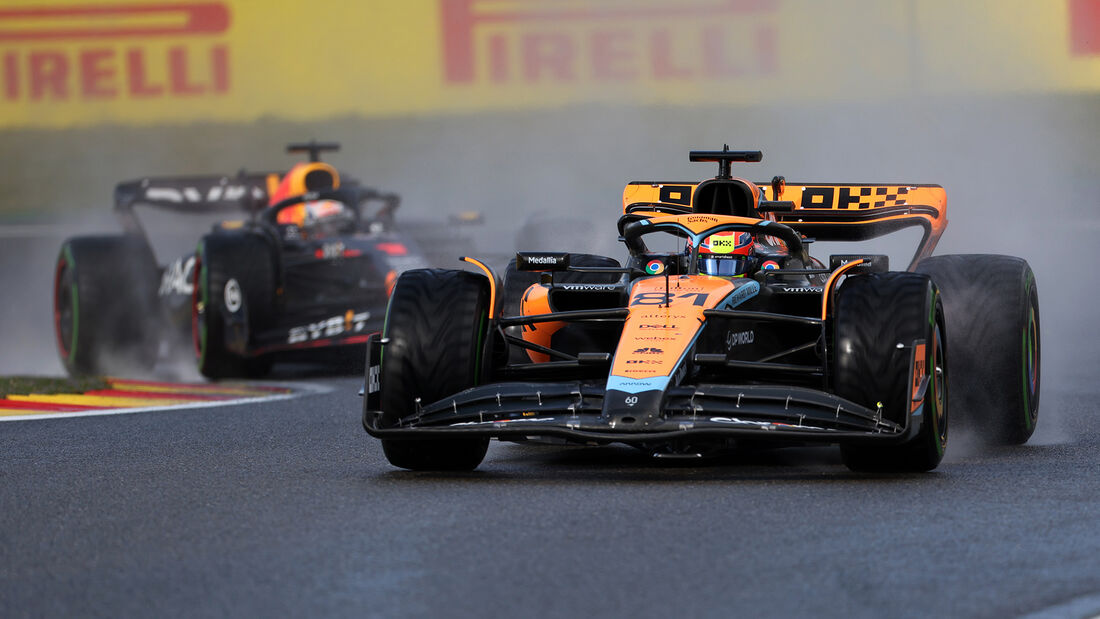
Even after his first lap exit at the Belgian Grand Prix Oscar Piastri is (so far) still producing the best rookie season since Lewis Hamilton (77.8) and better than the 2019 rookies (all below 70), Leclerc (72.2) and Verstappen (73.1). The main reasons for this are a) that Oscar seems to be very talented, as the model predicts him to have a similar ceiling to Norris (around 89) but that is still evolving and b) that Piastri is “already” 22 years old, compared to Verstappen who was 18 in his first year and Leclerc who was 21.
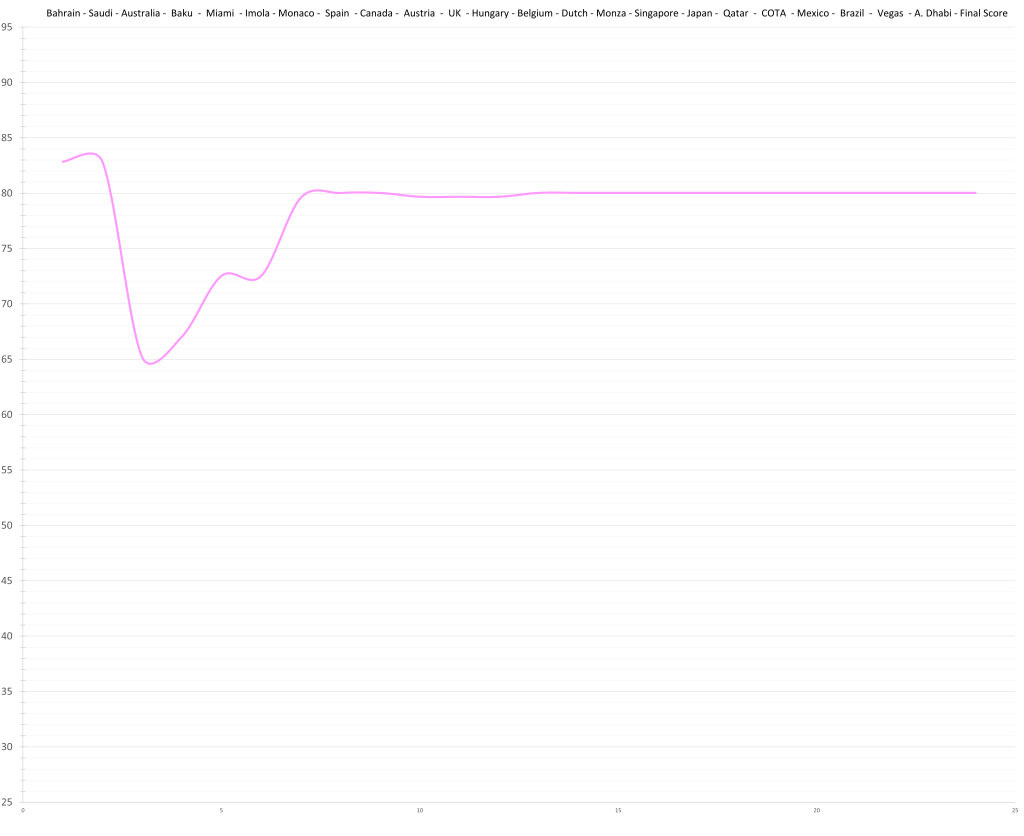
8 – Esteban Ocon – 80.0 (82.8)
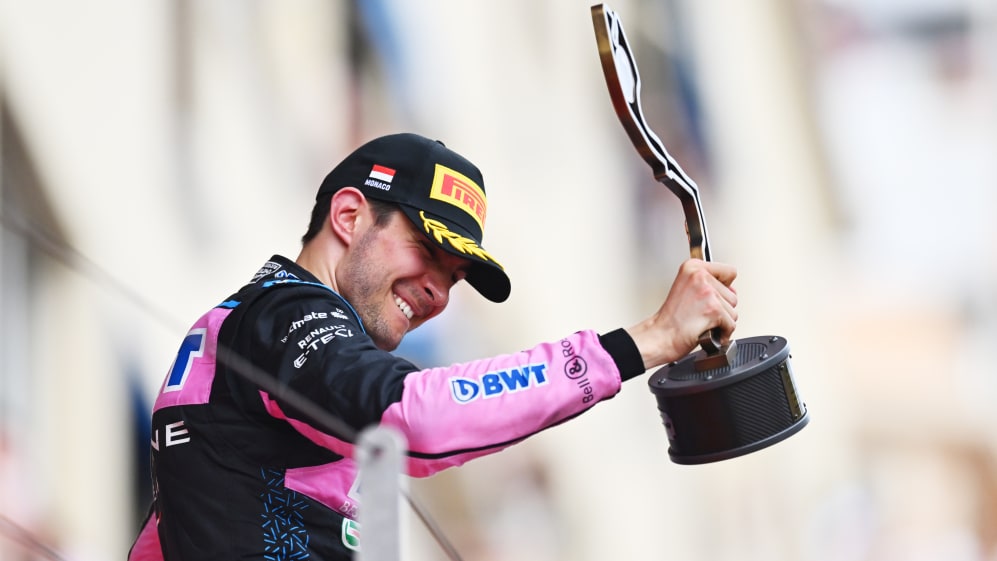
His trademark teammate crash in Australia and an underwhelming performance at the Austrian Grand Prix are definetly hindering his score but in the face of that 3rd place finish in Monaco, they become all but footnotes. Indeed, if Alpine doesn’t somehow start competing for podiums or Ocon falls completely off the wagon, his season rating won’t change by much. All in all Ocon is a very good driver but not on the level of the true superstars of his day.
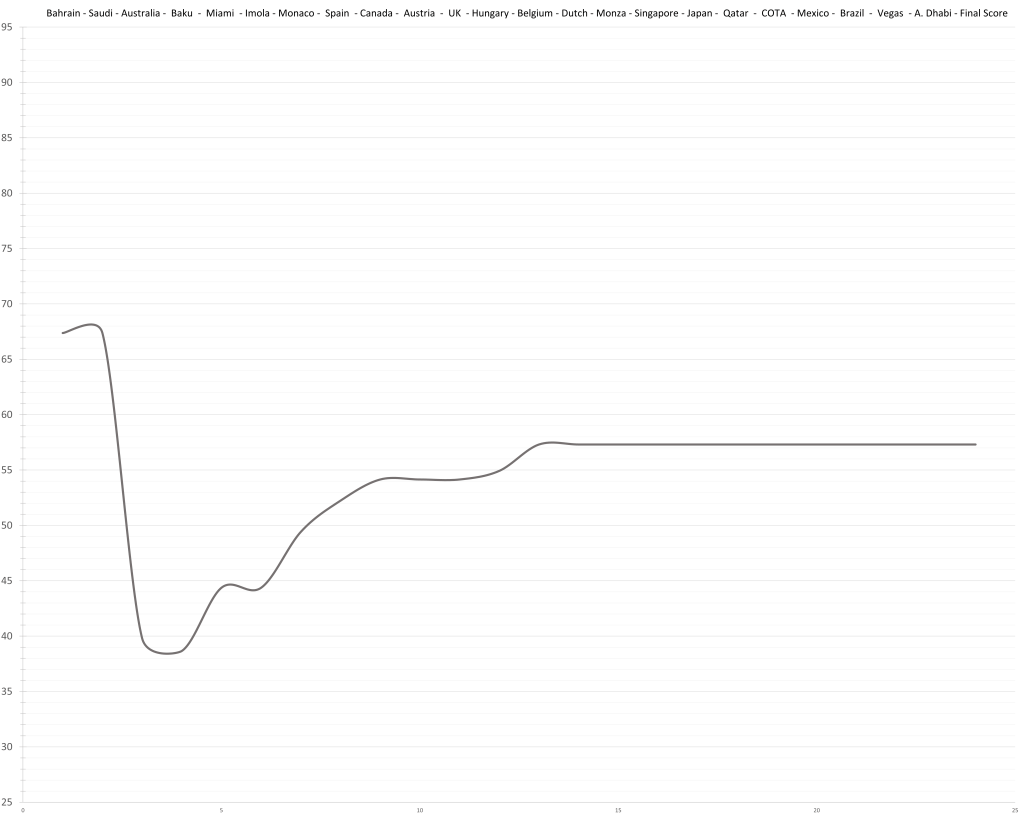
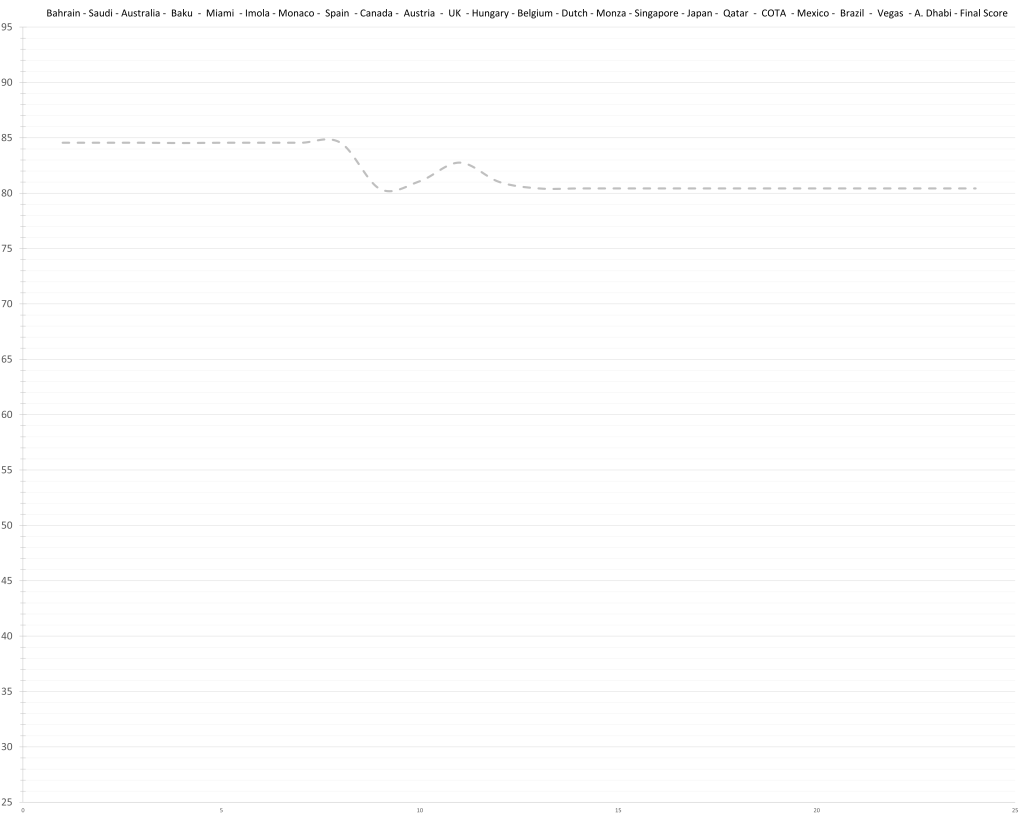
7 – George Russell – 80.4 (84.6)
Recently, Russell has been below his means. A crash in Canada, bad Quali in Hungary and the wrong set up in Belgium have contributed to a lower rating. He will probably be able to raise himself up again in the second half, though. The model rates Russell highly, but predicts his peak is Vettel-level which is somewhere around 86. That might be a bit low for some people, considering his junior carreer and Norris likely reaching 89. However Norris is the younger of the two and age seems to often be overlooked.
6 – Alexander Albon – 80.5 (82.1)
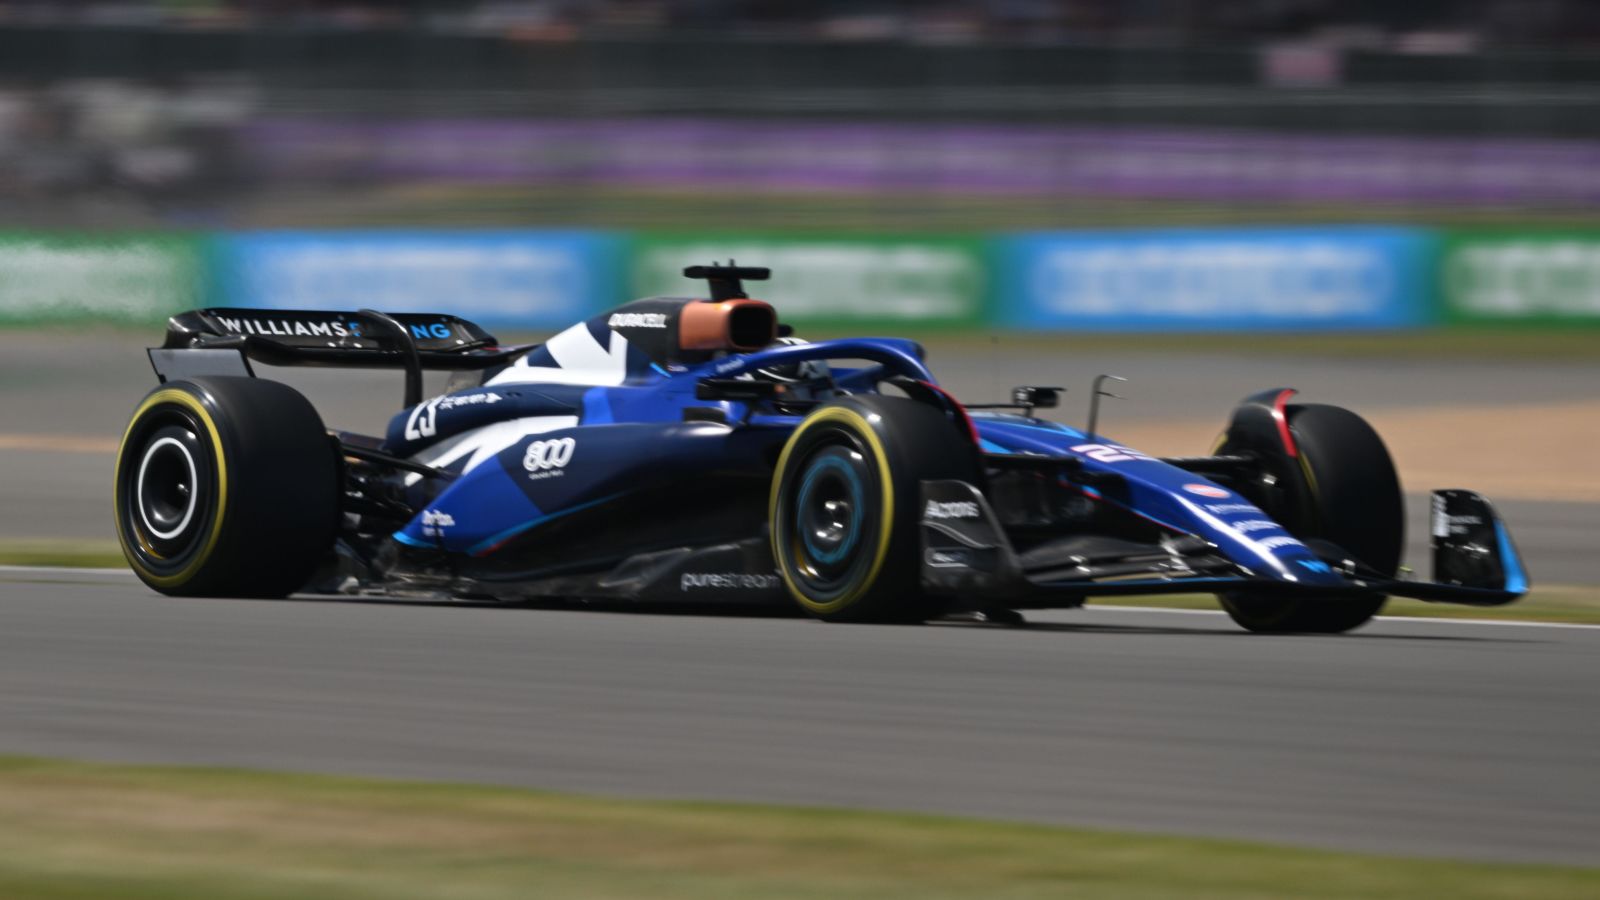
Disclaimer: The data on Alex Albon is not plentiful but this is as of now the most likely rating. Should the current evaluation be correct, the model puts Albon in the same category as Nico Rosberg (excluding 2016), Emerson Fittipaldi and Robert Kubica, meaning a ceiling of around 83. The Williams is rated as the worst car on the grid. Albon is doing a hell of a job.

The “Race For Second”
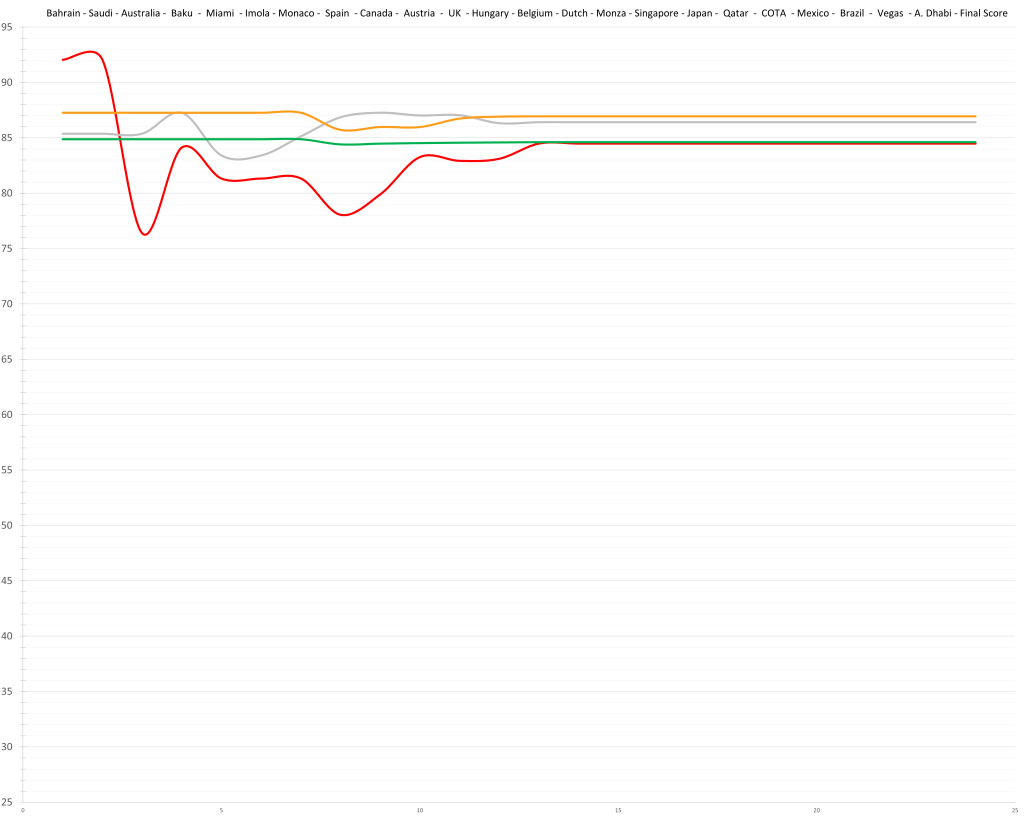
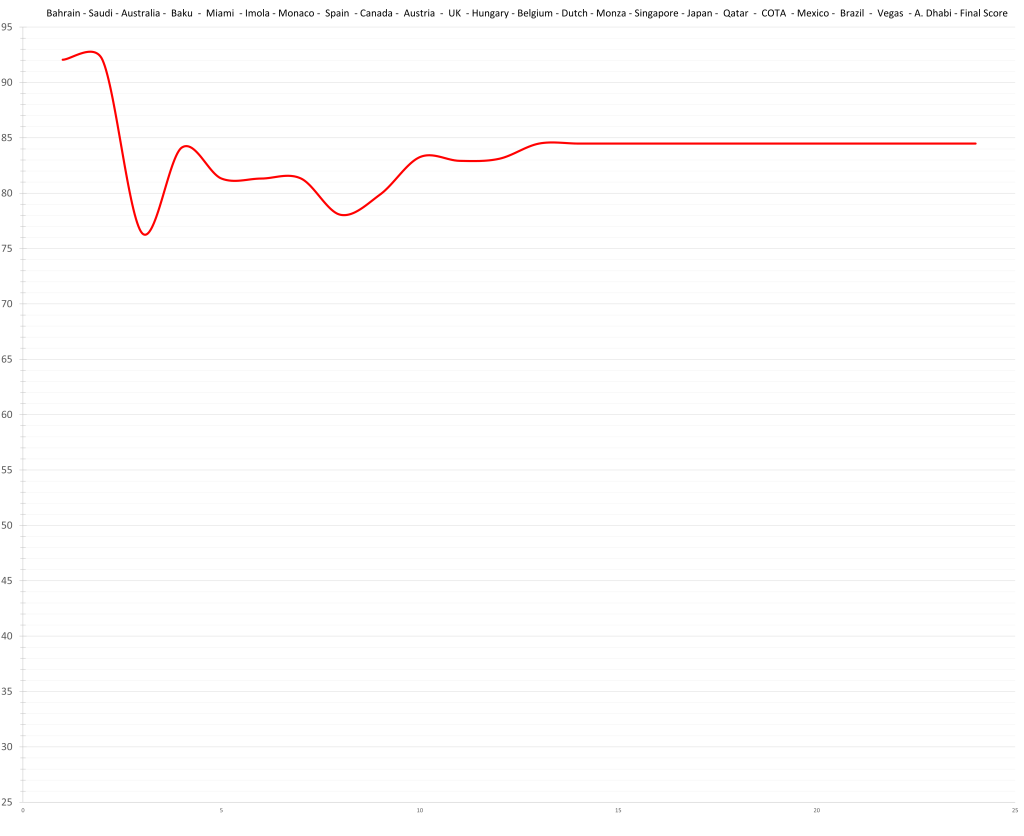
5 – Charles Leclerc – 84.5 (92.1)
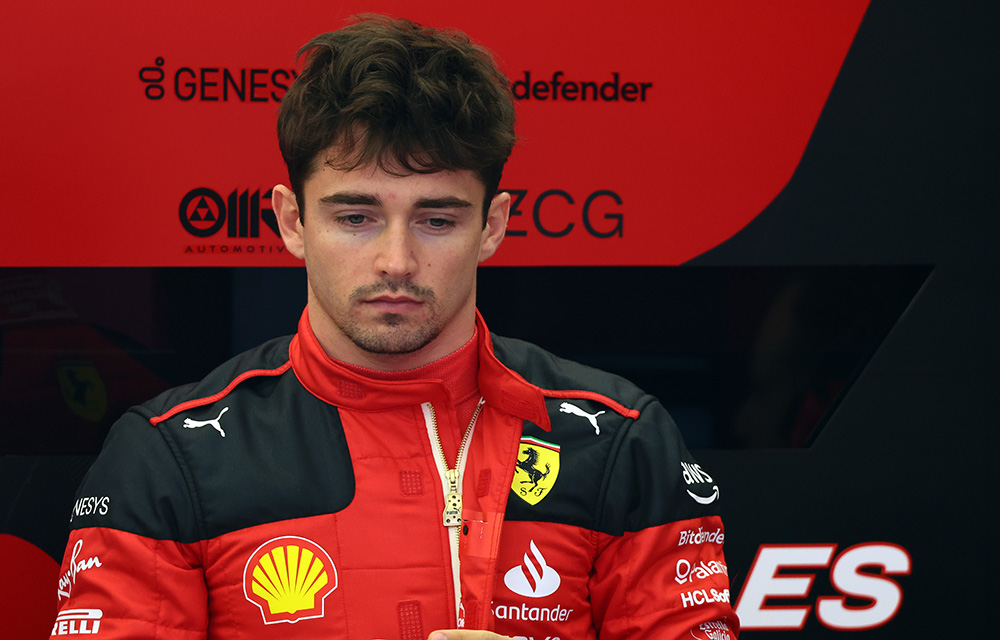
The highs are high but the lows are frequent for Charles Leclerc this year. When he is on, he is the second best driver on the grid and it isn’t close. At his best he is closer to Verstappen than to anyone else, topping out at 92. His rating is very sturdy as it is perfectly connected to both Sainz and Vettel. According to the model, he is undoubtably going to be one of the greatest drivers of all time; not with a season like this one, though. He luckily still has more than enough time to sort that side of him out. In 2023 he can still rejoin and even decide the race for second best in his favour.
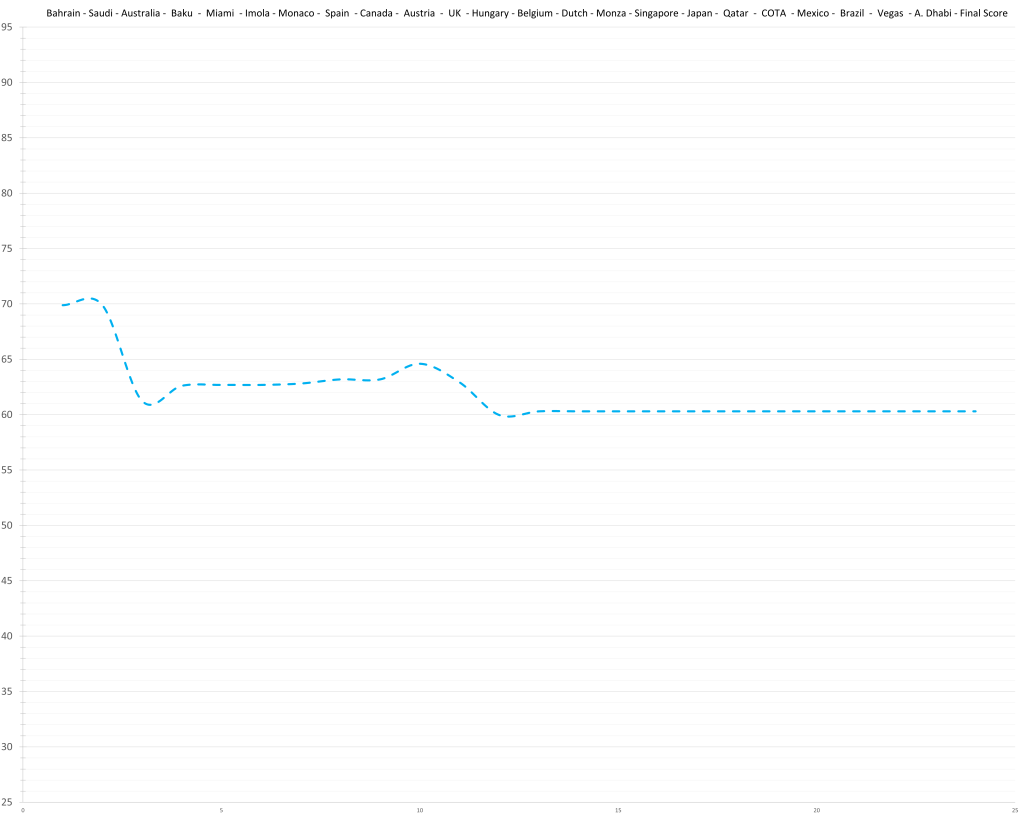
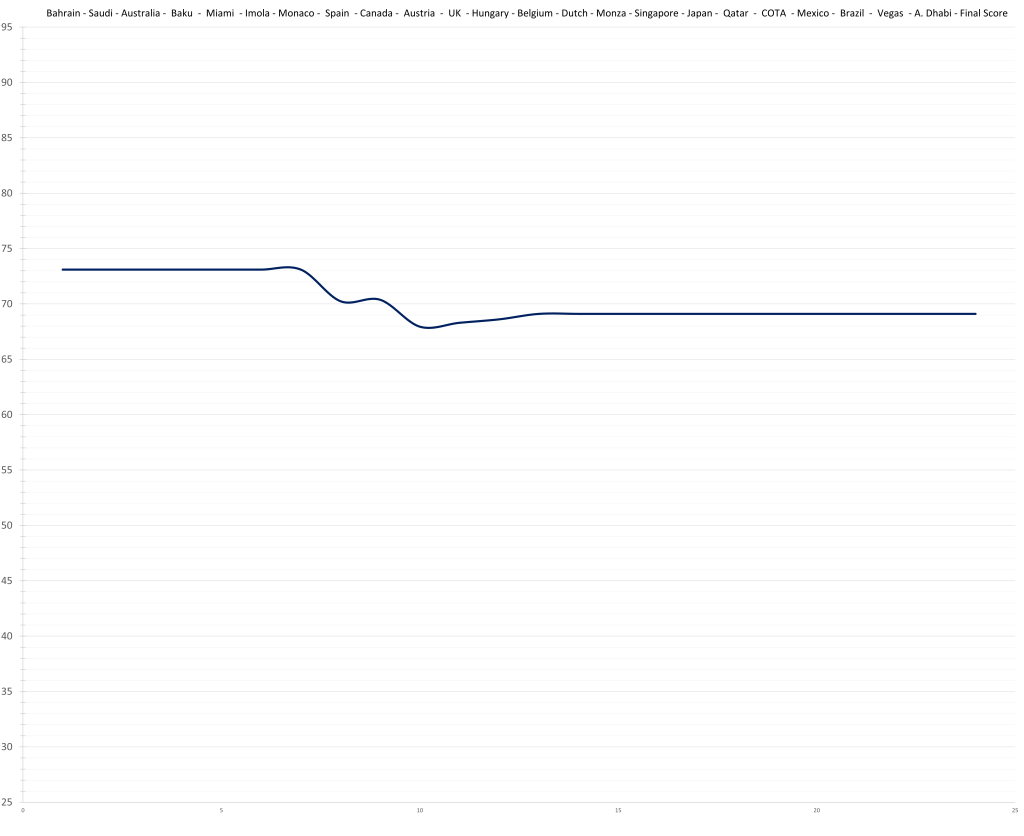
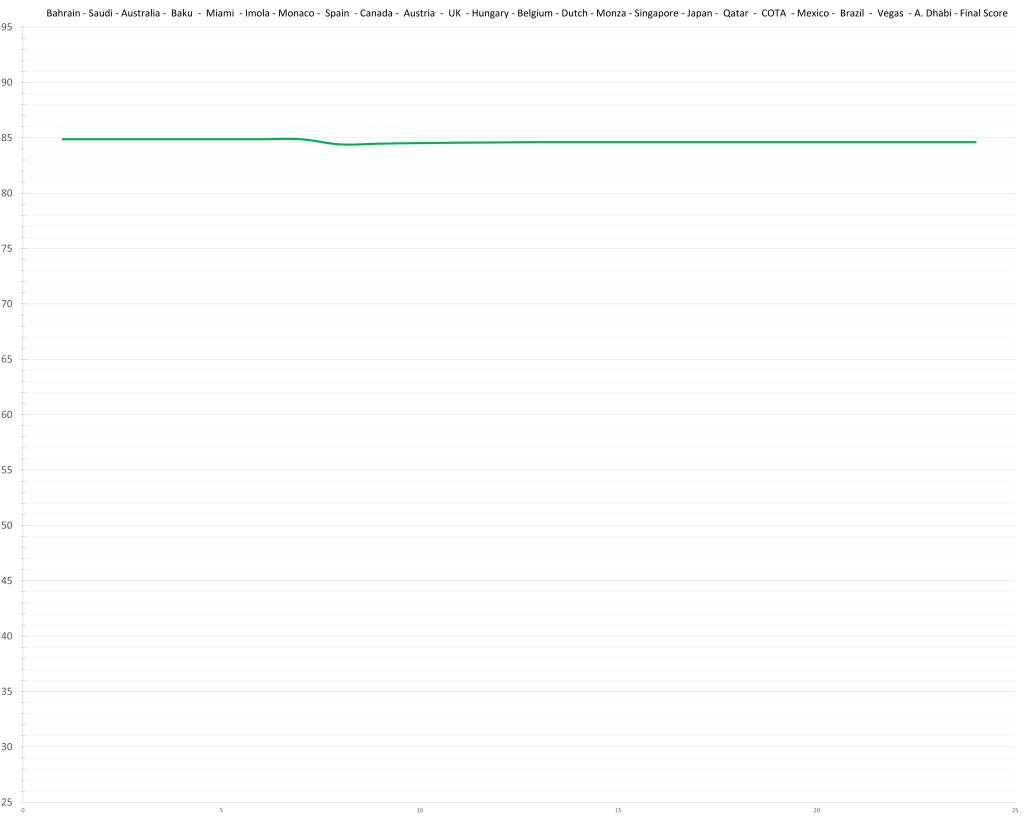
4 – Fernando Alonso – 84.6 (84.9)
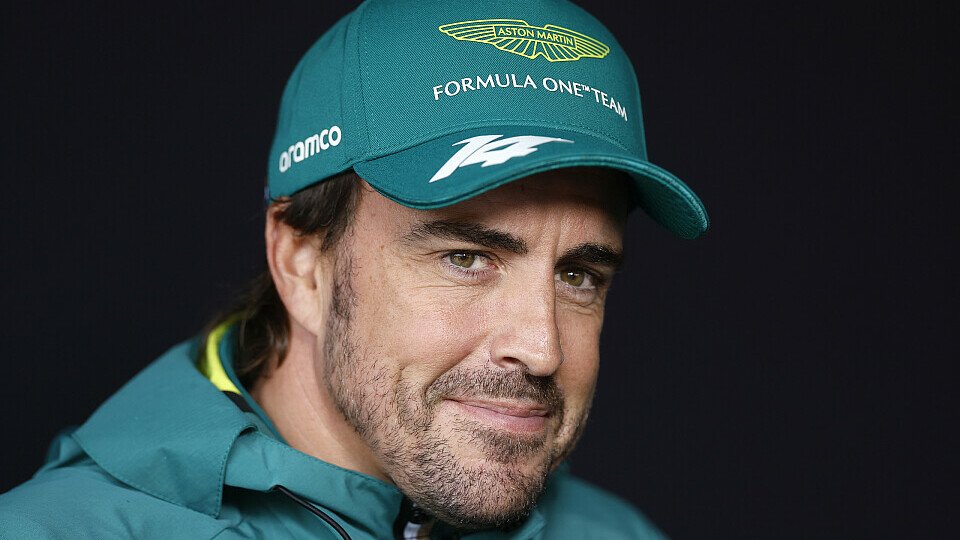
“No, he is not higher. If you look at his diagram you’ll notice he flat-lined. That is the mark of a driver of his quality. No mistakes, always in control. The only slight blemish came at Barcelona, where a mistake in qualifying led to him finishing behind Stroll (that and some good will). He is not higher because he is 42 years old, simple as that. He just isn’t as quick as he used to be (All-Time rating: 90.1). There might be a 1 in a Million chance that he somehow beat ageing (which would neatly explain Stroll’s underperformance) but that would be wierd as his last 2 seasons against Ocon fit perfectly on the age curve (and no one else ever did). At the end of the day not even Magic Alonso can beat time.”
This was the original text I wrote for Alonso at the time. Except for the very first sentence, it is still technically correct. But while Alonso did not beat ageing, it seems like during his hiatus from F1 he found a way to “simply” get better. Whatever it is he found, it has to be pretty significant, because everything Rosberg did in 2016, lead to an increase in performance that was about half as big as Alonso’s leap.
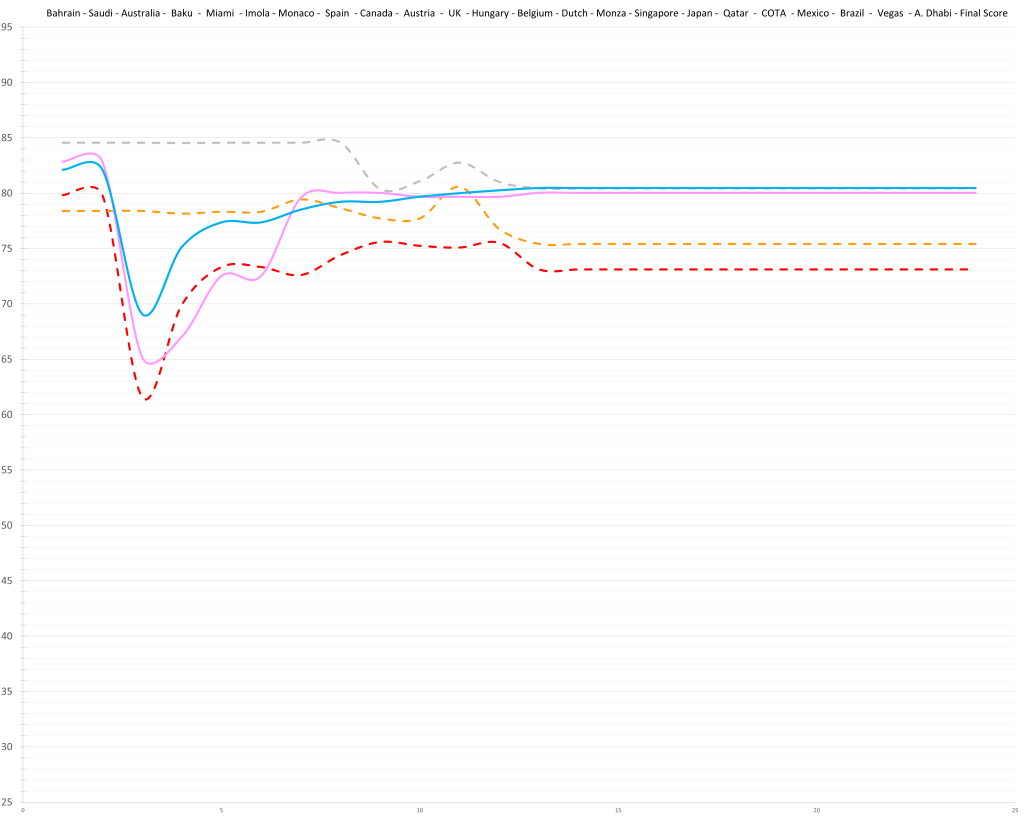
3 – Lewis Hamilton – 86.4 (87.3)
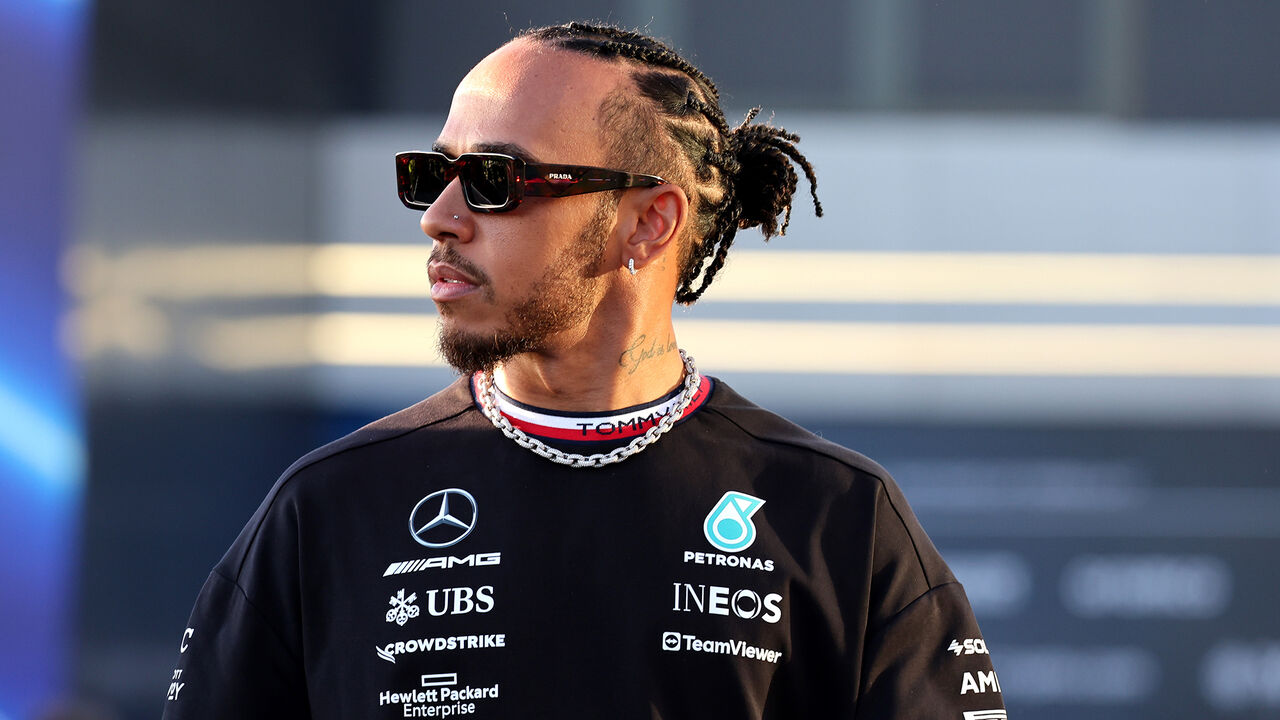
Lewis Hamilton has been super consistent over the last years, from season to season; almost as if age wasn’t a factor. But to the contrary, the model proves, that he is getting slightly slower but is also somehow making less and less mistakes to keep roughly even or arguably improve. The last 5 years read as follows: 80.0 – 81.5 – 84.4 – 83.1 – 86.4*. That is really remarkable, especially after the age of 37. On the other hand, it also shows that Lewis wasn’t getting the most out of himself in most seasons (notable exceptions are 2014 and 2018). This year might actually boost his All-Time rating (89.1) which takes the top 4 seasons of a driver into account, if he keeps this up.
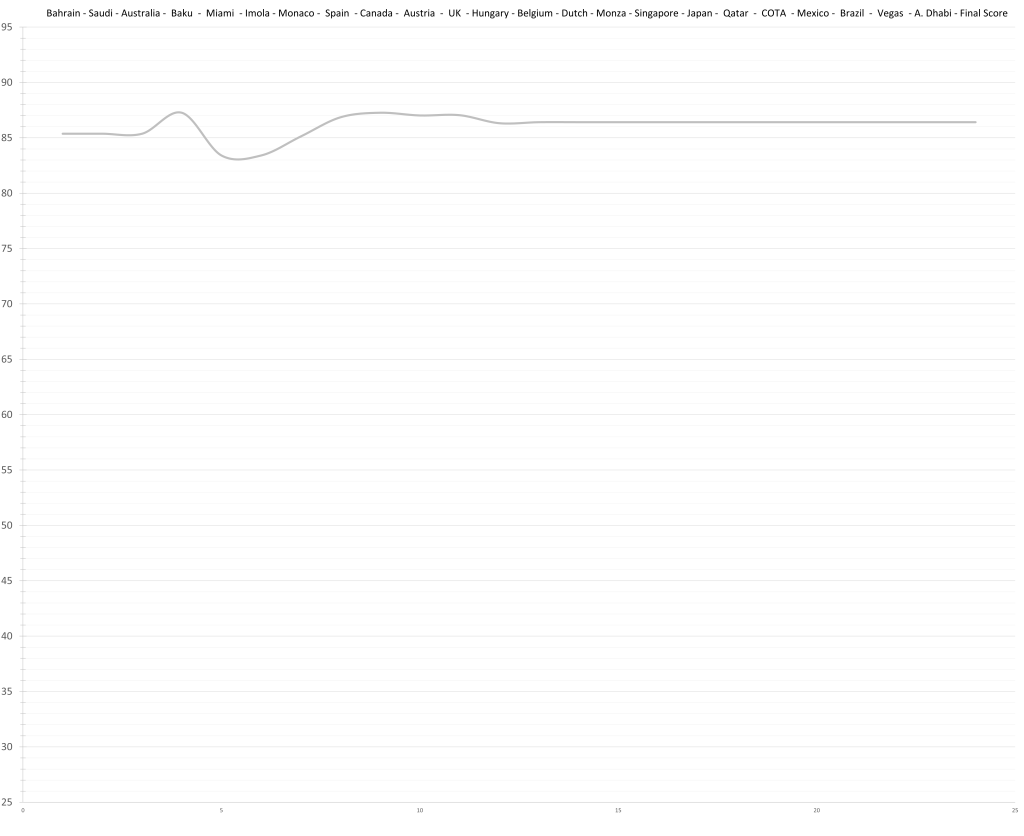
2 – Lando Norris – 86.9 (87.3)

Lando Norris’ rating is very sturdy (for the Norris-doubters out there). The dip in his season rating originates at his clash with Hamilton in Barcelona that saw him throw away a great qualifying in the matter of 3 corners. It hardly matters, however, because of McLarens recent resurgence. Due to his age Lando will only enter his prime in 2 years. Until then he is still getting better. If he can be mistake free it is not impossible for him to overtake Hamilton in the All-Time rankings, once it’s all set and done.
The “Maximum”
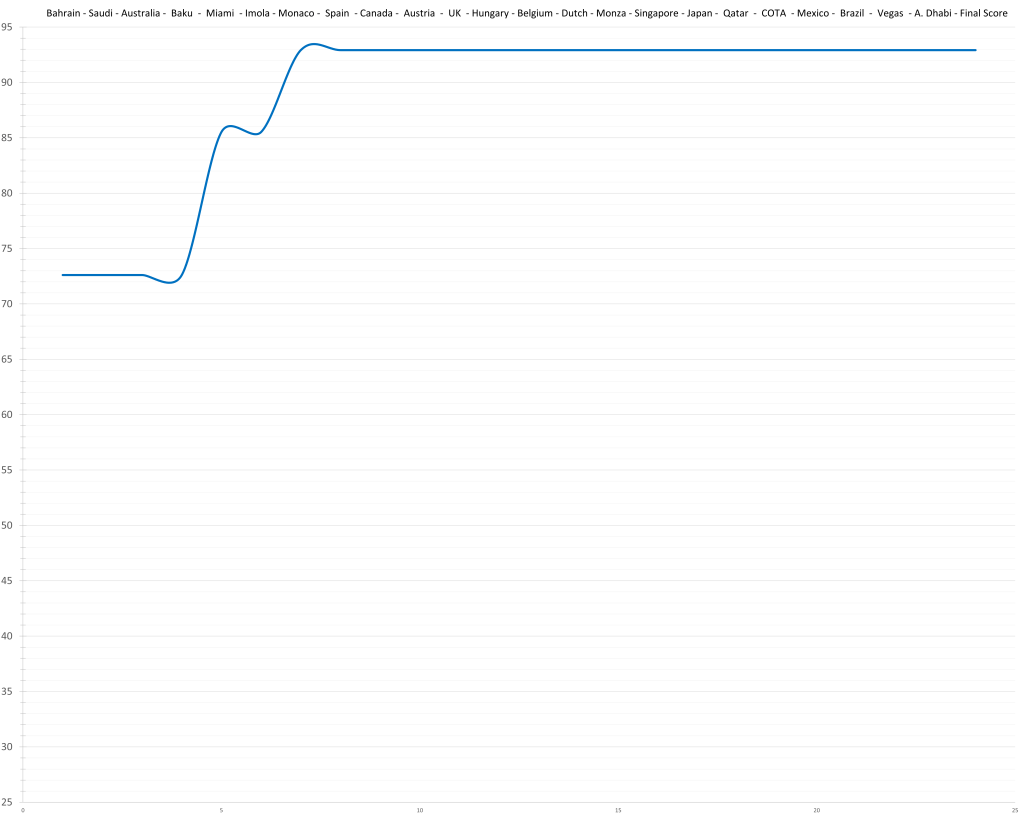
1 – Max Verstappen – 92.9 (92.9)
Max Emilian Verstappen is having a perfect season so far. His 2023 season (so far) is the best single season performance since Schumacher in 2001. He is one of the few drivers, the model puts within uncertaintity of GOAT status (although he is not the front runner). A quantum of solace: He is done. This is it. He is probably not getting any better. With enough seasons under his belt to be a veteran he won’t get any growth through experience and at 26 years of age he is at his physical peak. At long last we have reached Maximum Verstappen.
A Quick look At The Teams
- Red Bull
- Aston Martin
- Mercedes
- Ferrari
- McLaren
- Alpine
- Alfa Romeo
- Alpha Tauri
- Haas
- Williams
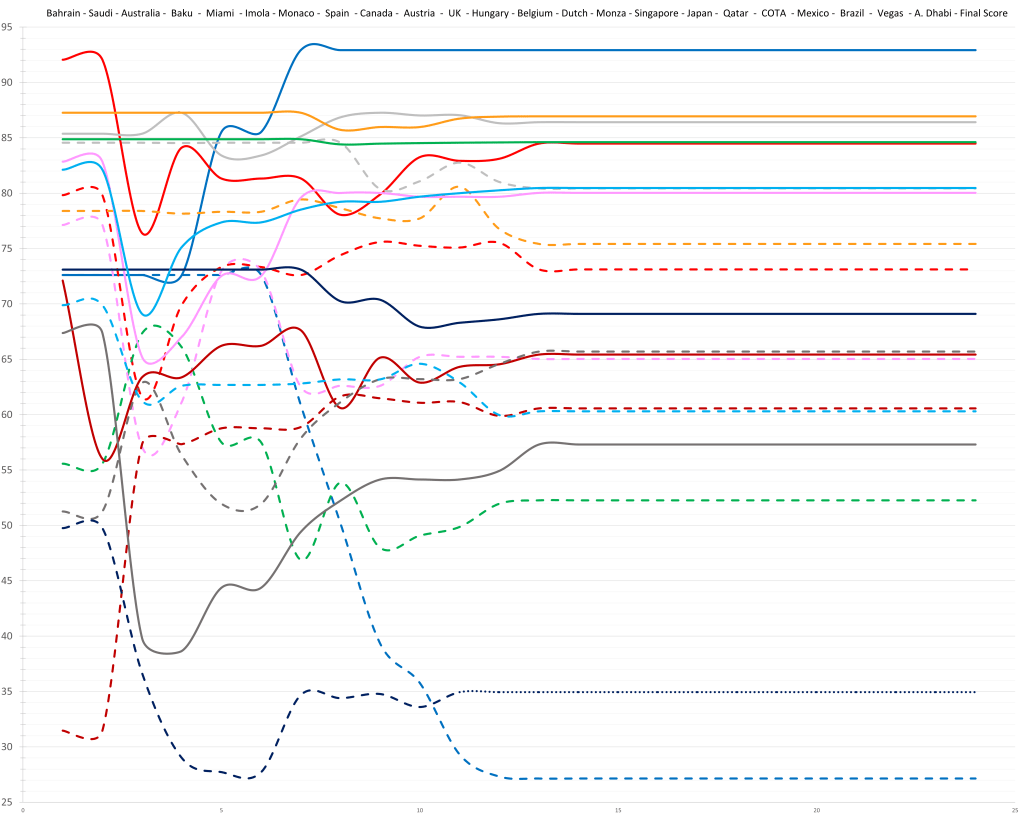
Nothing out of the ordinary as you can see. McLaren will obviously not stay put with their recent form and might make their way towards the top 4. Another observation: Red Bull is further ahead of 2nd placed Aston Martin than Aston is ahead of last placed Williams, showing both RB’s domination and how close the rest of the grid is to each other.
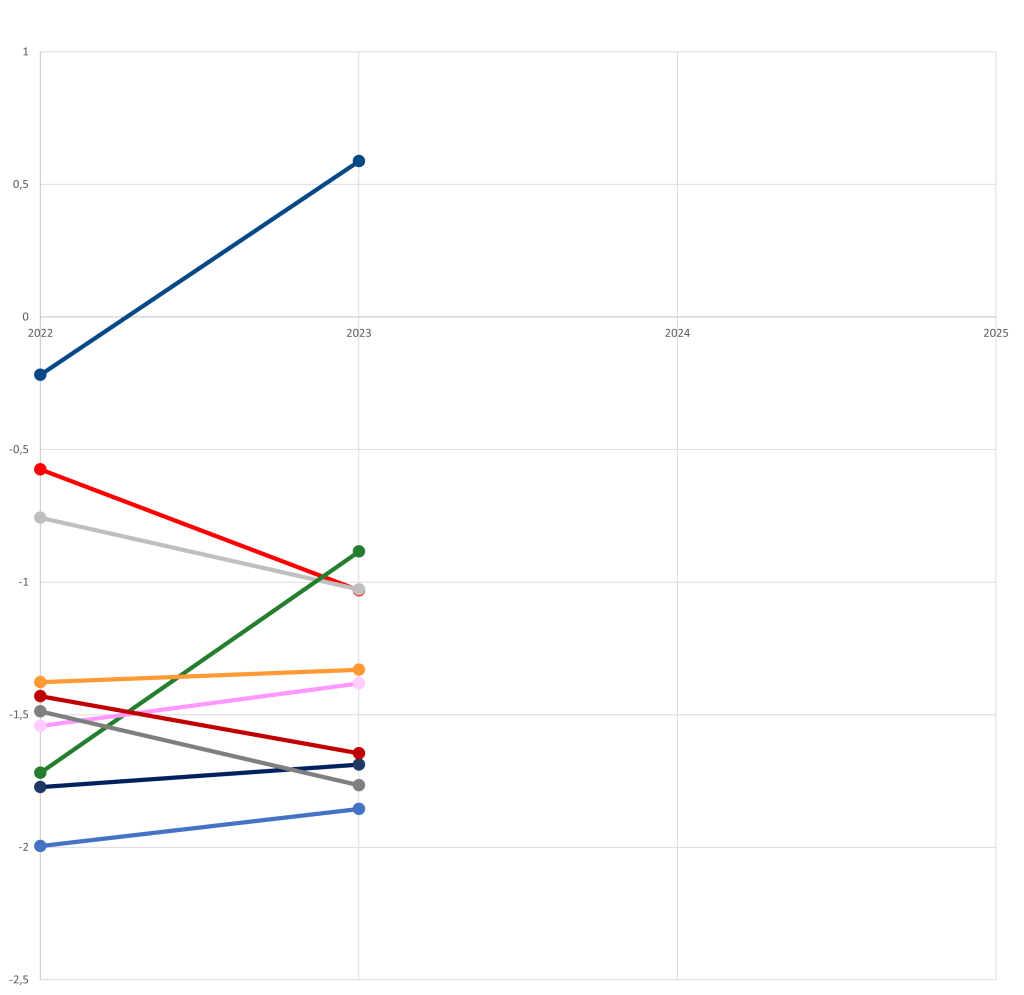
The season to season comparison with 2022 shows just how big of a step Red Bull and Aston Martin took over the winter. It also shows the 3 Ferrari affiliated constructors going down in parallel. To be fair, so did Mercedes.

Leave a comment