
The 2023 Formula 1 season is over and it was one for the history books. Records were shattered left and right, there was a lot of movement in team performance up and down the field (except for where it mattered most), several drivers have shown to have what it takes, given the right car and some did the opposite. The mathematical model seeks to eliminate the factor car by only measuring drivers against their teammates.
How Does It Work?
My model was inspired by the amazing f1metrics model and therefore shares a significant portion of its methodology.
Step 1 was to introduce a unified points system. P1 gets 10p, P2 gets 10p*0.72=7.2p, P3 gets 7.2p*0.72=5.18p …. etc. all the way to P20. Driver related DNFs are scored with 0p.
Then the 2 teammates get their points assigned for every race. Races where one driver has mechanical issues are excluded (or corrected if possible). Driver errors and other incidents are also excluded (or corrected if possible). Now the points are tallied up and converted on an s-curve. The difference between the two values of the drivers is the performance difference between them.
In combination with functions for age and experience (I use those of the f1metrics model), doing this with all drivers over a lot of seasons, results in a pretty sturdy web of relative driver performances. While building this web, I am not looking for a compromise of all seasons but instead a most perfect fit.
Season Ratings
Now that I have performance ratings (later referred to as ceiling/pace/potential) for the drivers, I can get a value for the car/team in a season since
(points)=(driver performance)+(car performance)
and therefore
(car performance)=(points)-(driver performance)
The driver errors are then added back in, giving a new points total, and through
(points)-(car performance)=(driver performance)
I get the actual performance of the drivers in that season. Those performance ratings are then translated back over the s-curve to give a “points per race rating” which goes from 0-10. That is then multiplied by 10 to get a neat driver score of 0-100.
As you can see, the major difference to the f1metrics model is the handling of driver errors. In my opinion this results in more accurate ratings as the amount of errors a driver makes can vary widely from season to season. Secondly, it has the advantage of untieing teammates in a season. A drivers rating won’t automatically get boosted just because his teammate is having a shocker.
At its core the model is assessing a drivers ability to score points with
(total points)=(possible points)-(lost points)
This can be abstracted onto the drivers. Simplified the drivers’ season ratings can then be understood as
(driver rating)=(driver pace)-(driver mistakes)
To help give some perspective for the ratings I made these tiers:
- S – above 89
- A – above 82
- B – above 73
- C – above 62
- D – above 50
- F – below 50
From going through all the data and seasons, I would say that generally a good season has a score above 73. Keep in mind, though, that there are no real cut lines. Another bit of context is that the median performance usually sits somewhere in the 60s. In 2021 it then jumped above 70 for the first time in 40 years, and has stayed in the 70s ever since.
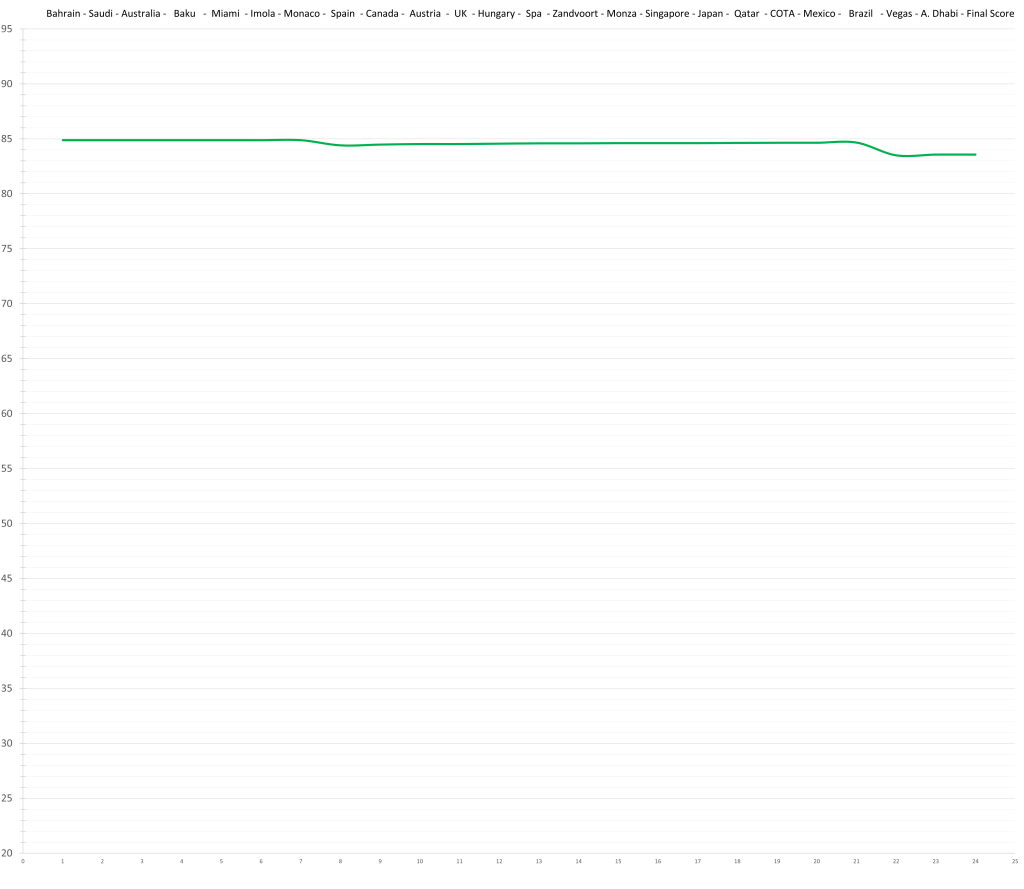
Each driver has their own entry including a graph documenting the change of their season rating through the races, a short summary and of course the actual rating. Behind the rating (in parentheses) you’ll find the drivers expected baseline rating for the 2023 season. It roughly equates to pace and can be understood as a ceiling (only for this season since this value moves with age and experience). It gives you a better understanding and context for the actual driver rating in terms of underperformance, mistakes, consistency, speed etc.
The “Unworthy”

20 – Nyck De Vries – 33.3 (45.0)

Literally nothing happened since July, so like his season, I’ll cut this short. He didnt make it to the summer break for a good reason. The weak Alpha Tauri somewhat hides how poor he was since there wasn’t much to lose out on (unlike with Checo in the RB). The model sees him as a 45-ish level driver which is terrible. Even if you consider him to be like any other rookie, he would likely top out around the high 50s, at which point age would already be a factor.
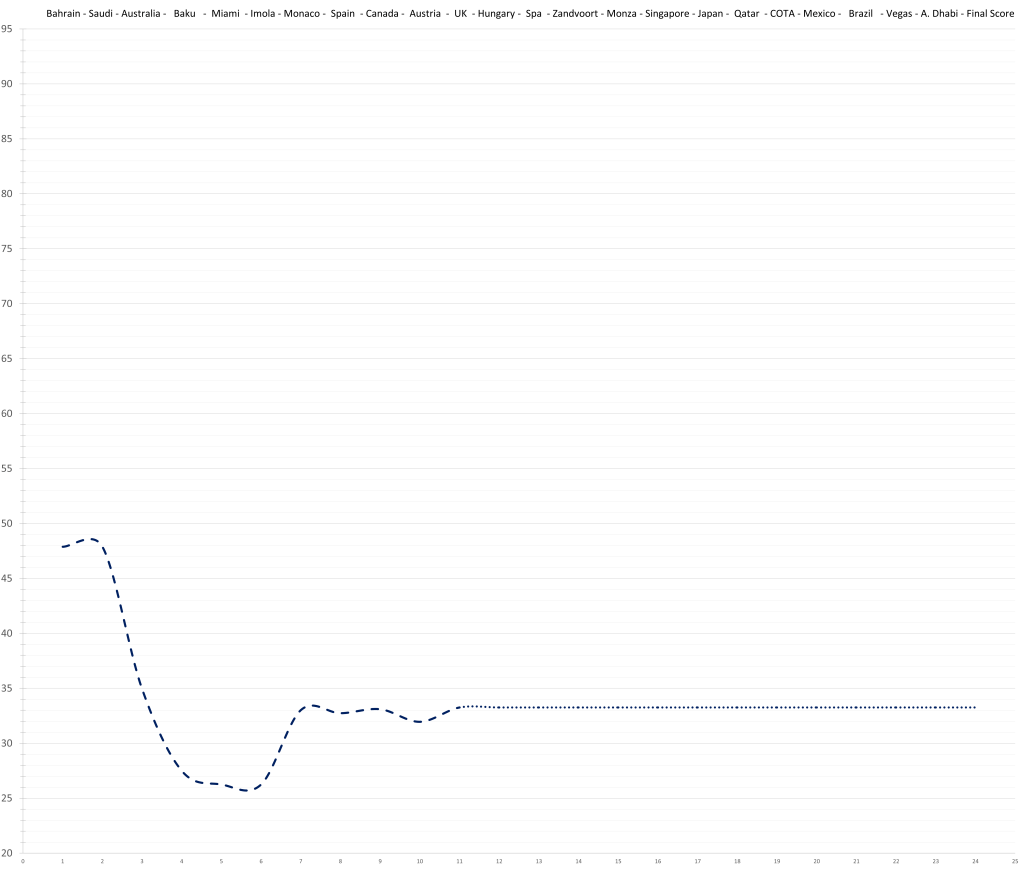
19 – Sergio Perez – 49.0 (71.6)
” ‘Twas horrific. But I have to concede that the model runs into problems with extremely dominant cars steered by two drivers who have little to no overlap in quality due to first places being a perfect 10/10, which would be undefined on an asymptotic function without context. This might have been the case with Verstappen and Perez, and was definetly the case with Verstappen and Perez in an oversteery car. The result is a “raw” rating of 31.6. Fortunately, this is a rare phenomenon. The only other cases I have encountered so far have been Williams 1992 and to an extent Ferrari 2004.
I made an attempt to combat this with the introduction of clones to get more differentiated results. This process is made relatively simple due to Verstappens impeccable season. The downside of this method is a relativation of bad results. With this done, Perez is rated around 53, which for the aforementioned reason would put him a little lower, probably close to 50. This would still classify Perez as the worst driver who wasn’t fired mid-season – albeit by a substantially smaller margin. However, while this method seems logically sound, I haven’t looked into it enough to confirm this. In addition it can’t provide a specific rating, only a suggestion on the high end, because results are inherently skewed.”
The above was the original comment on Perez’ season. I have since refined the clone methode to great results. This has a small effect on Perez’ 2022 season and a big one on his 2023. He is now rated 49.0 which still puts him adrift of the rest of the grid, but not by far the worst driver of the season.
The “Barely OK Crowd”
18 – Logan Sargeant – 56.6 (58.7)
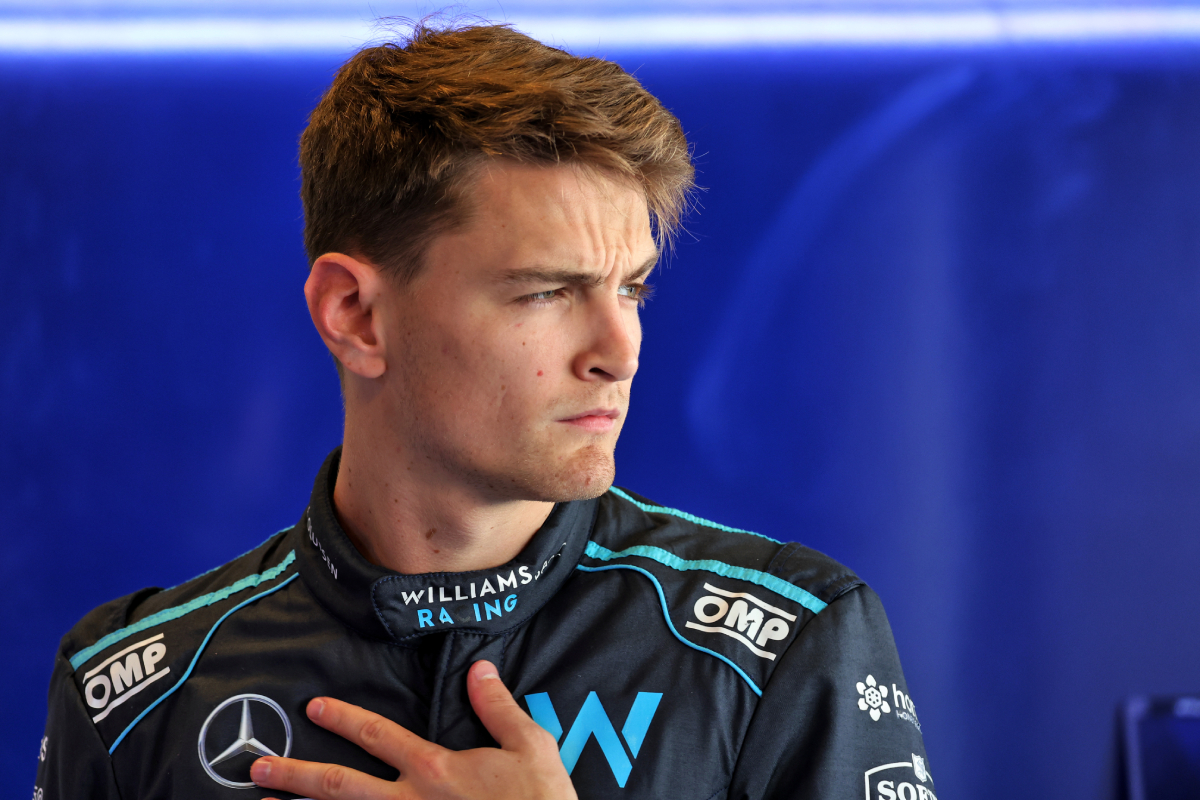
Although the range for his pace and ceiling are still relatively big, the model does not consider Logan Sargeant a lost cause by any means. His current high end evaluation takes him as high as Ocon or Albon, while his low-end would still take him to Oscar-Piastri-rookie-level, which is evidently a viable option for any team – at least as a second driver. Logan hit a big slump right after the summer break, where he was arguably trying too hard. It is probably not too big of a leap to speculate that this stemmed at least partially from being criticised heavily for not being able to keep up with his teammte, Alex Albon.
17 – Kevin Magnussen – 57.6 (66.8)

The incredible inconsistency and error proneness of Haas make it almost impossible to get a good read on Magnussen’s true level even against a well established driver like Hulkenberg. Hopefully, more seasons together can narrow him down a bit. In 2023 Kevin’s pace was not too far off Hulkenberg, eventhough the general feeling was more or less a battering. Hulkenberg’s quali-centric style made for great highlights and since Haas were basically non-existent in races, qualifying becomes the main form of measurement. This is, however, not fair to Magnussen. In counting races he loses the head-to-head 6-10, with 3 of those losses coming through crashes.
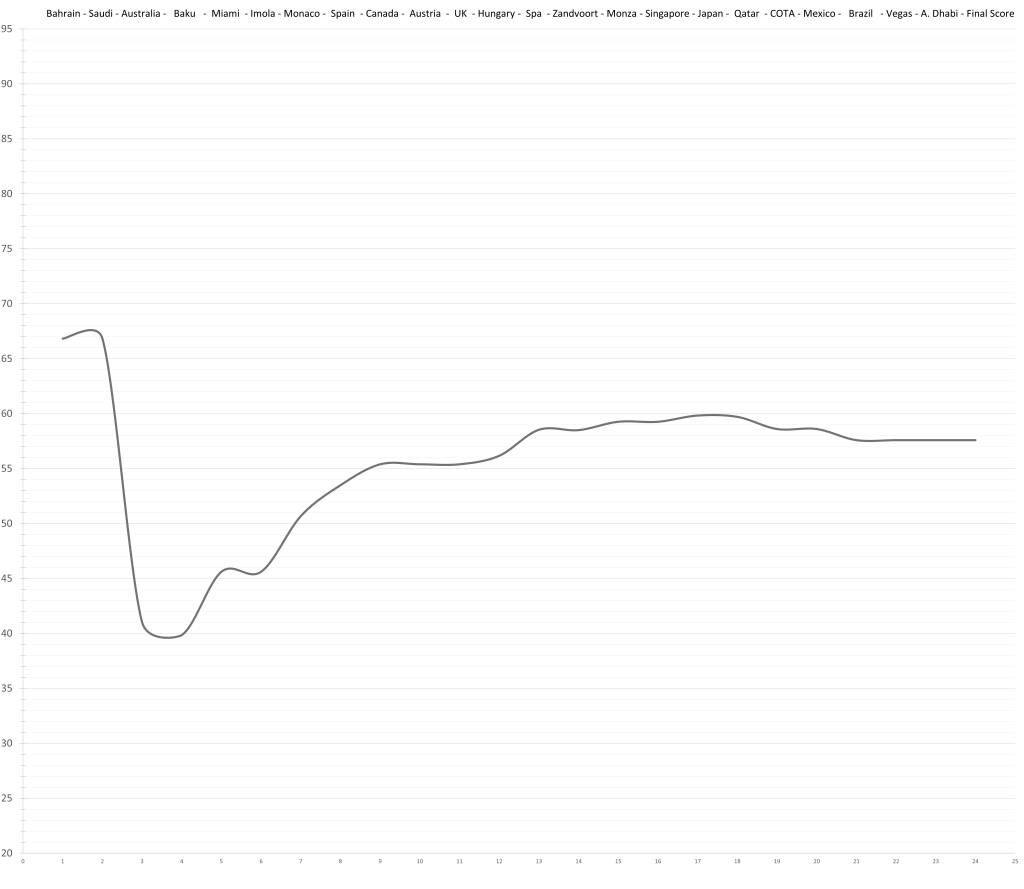
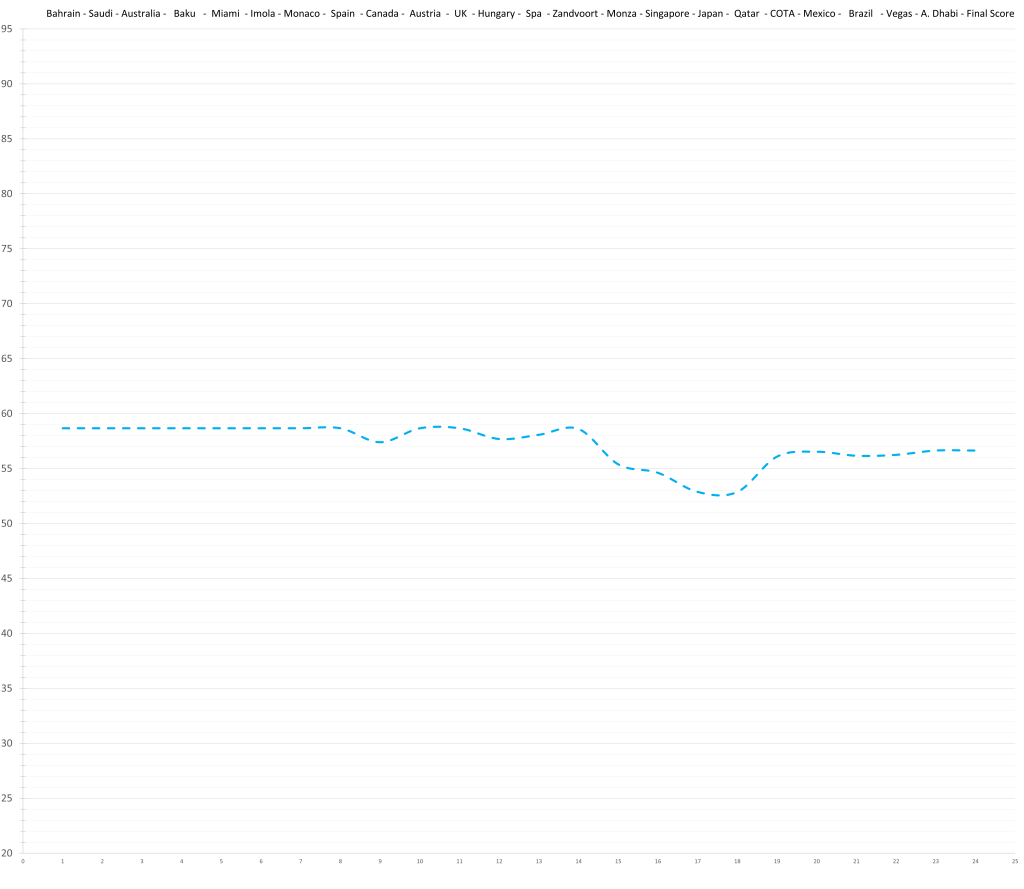
16 – Zhou Guanyu – 58.0 (61.1)
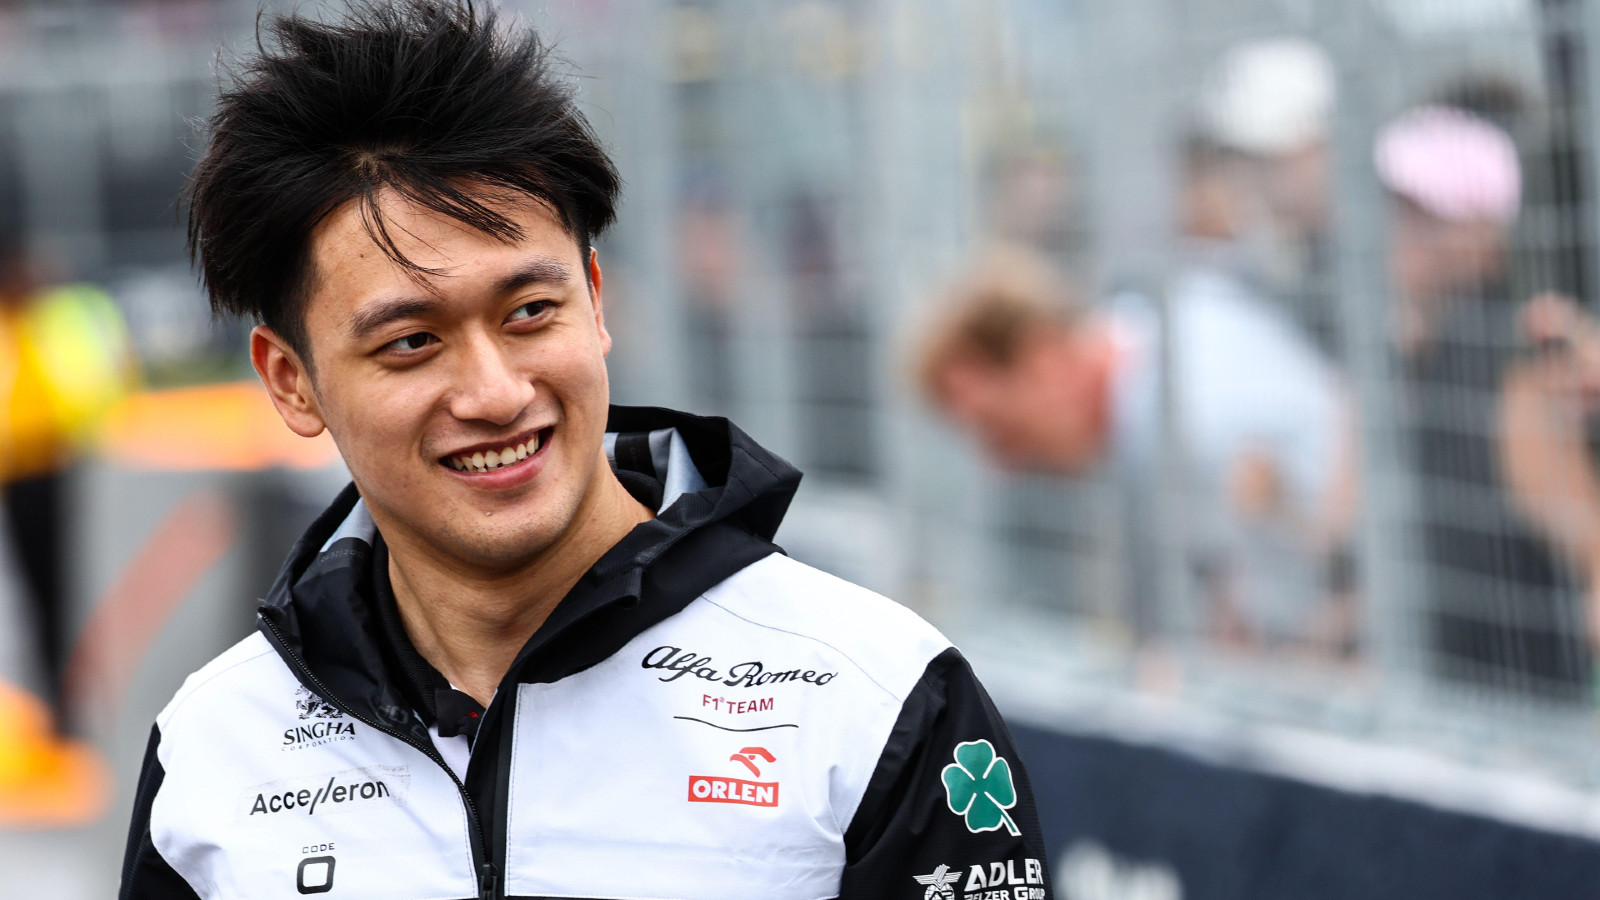
After two full seasons there is some good data to suggest that zhou will fall short of ever reaching the level of drivers like Bottas, Perez and Hulkenberg. That won’t be enough to keep his seat in the long run; with the increasing profitability of Formula 1, maybe not even with his funds. From this point of view it seems almost riskless for Sauber to try out Theo Pourchaire.
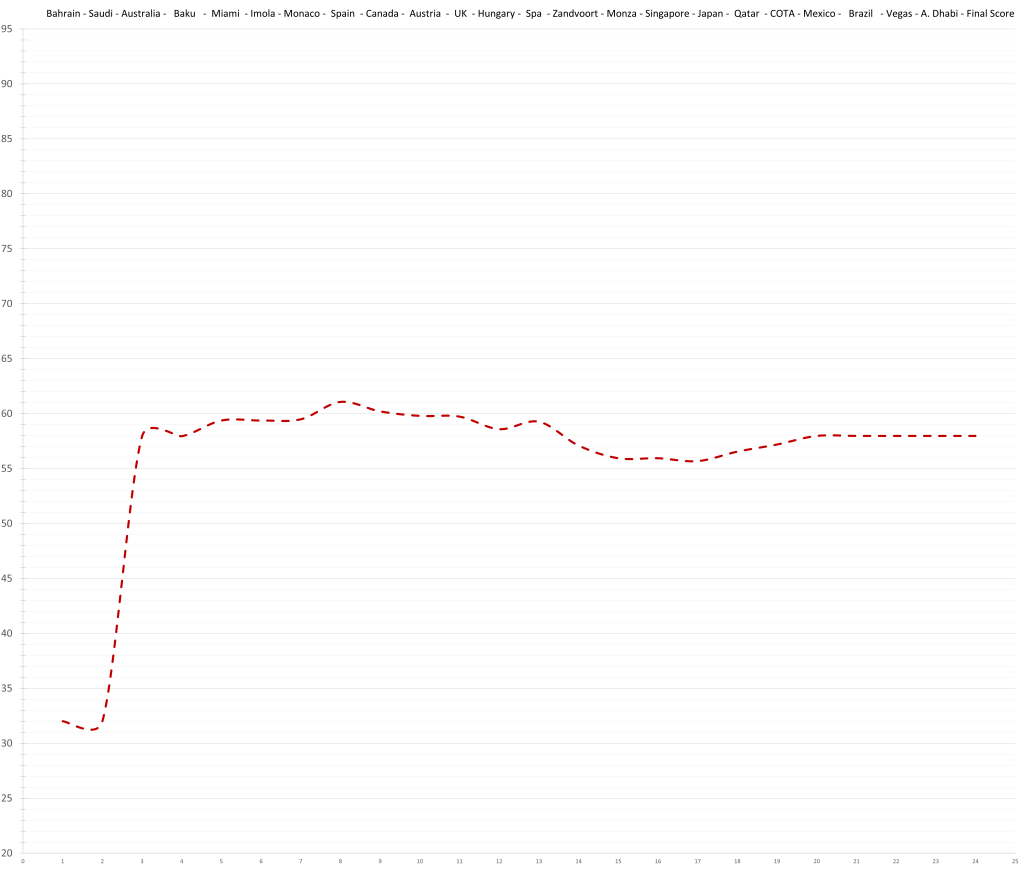
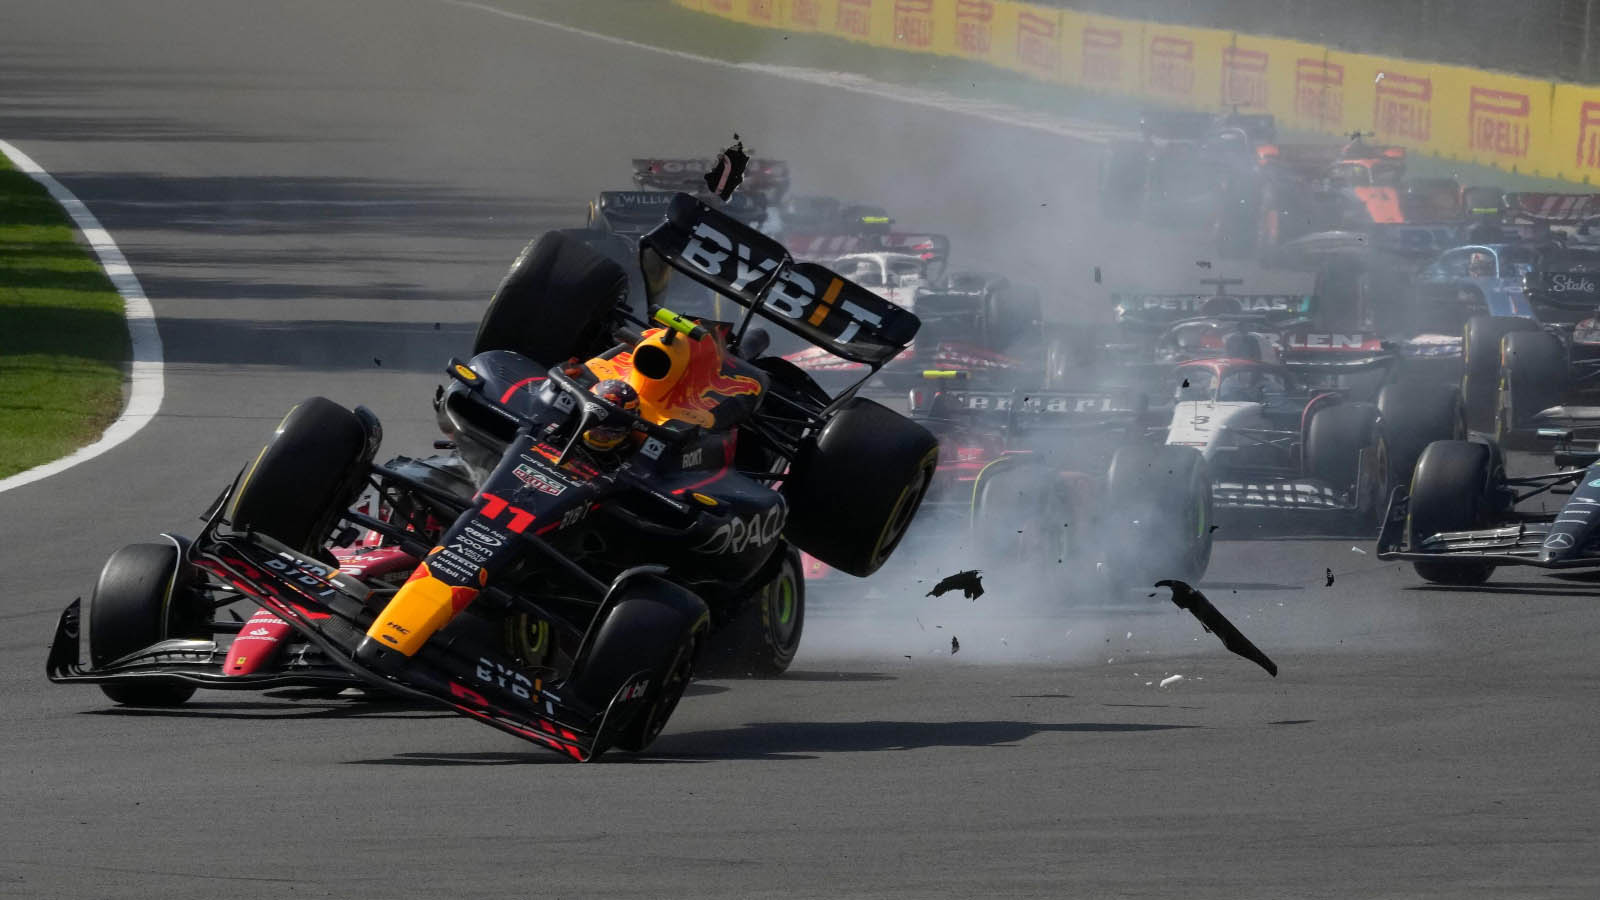
15 – Lance Stroll – 59.2 (72.1)
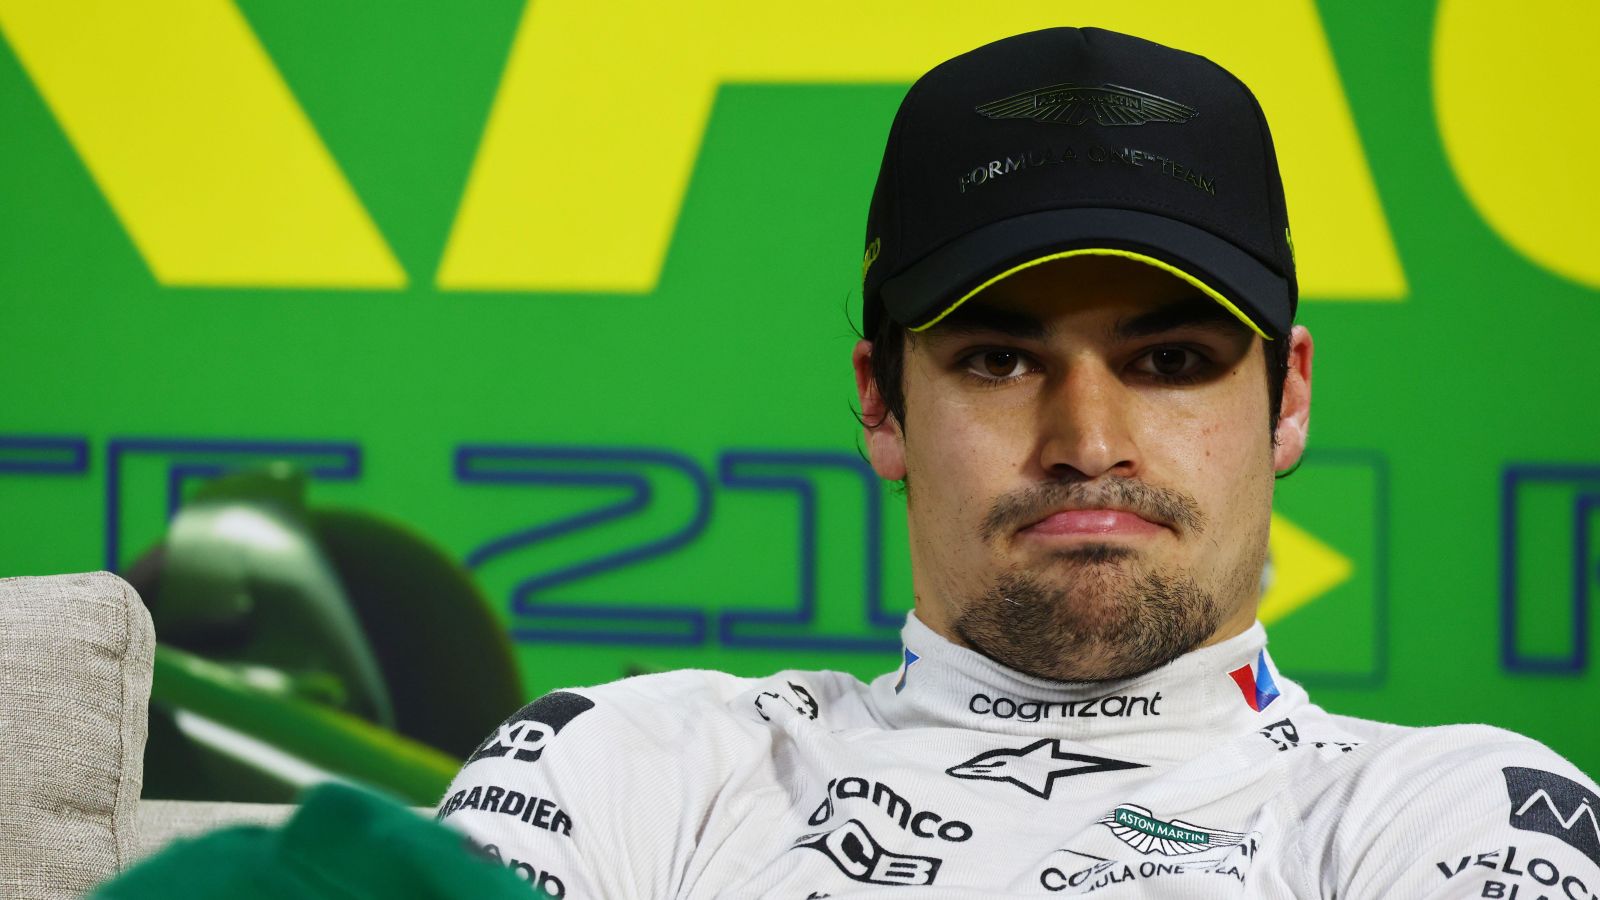
A relatively strong end to the season improved Lance Stroll’s score by a bit, but all in all it was a very weak season. He manged only 36% of his teammates points in counting races, the worst ratio of any driver pairing in 2023.

The “Unspectacular”

14 – Valtteri Bottas – 64.3 (72.6)

Valtteri Bottas has probably taken part in most if not all races of the 2023 Formula 1 season.

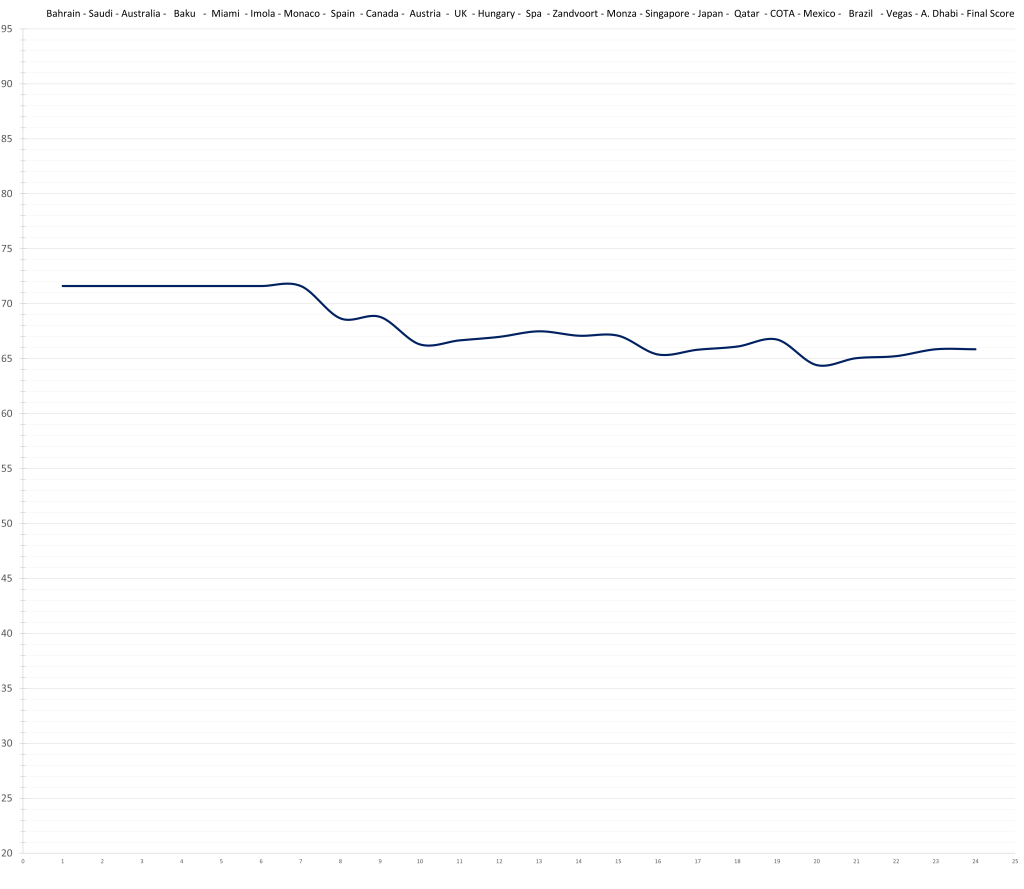
13 – Yuki Tsunoda – 65.8 (71.6)

This season had little significance for Tsunoda’s uderlying rating. Three different teamates of whom two were rookies unfortunately can’t deliver any information beyond a suggestion over a very small sample size against Ricciardo. Although Liam Lawson impressed in his cameos, Ricciardo driving the whole second half of the season would have been immensely helpful for both drivers’ ratings. Due to Yuki’s expected improvement and Daniel’s slight age-related decline, the model projects Ricciardo-Tsunoda to be one of the closest driver pairings on the grid next year.
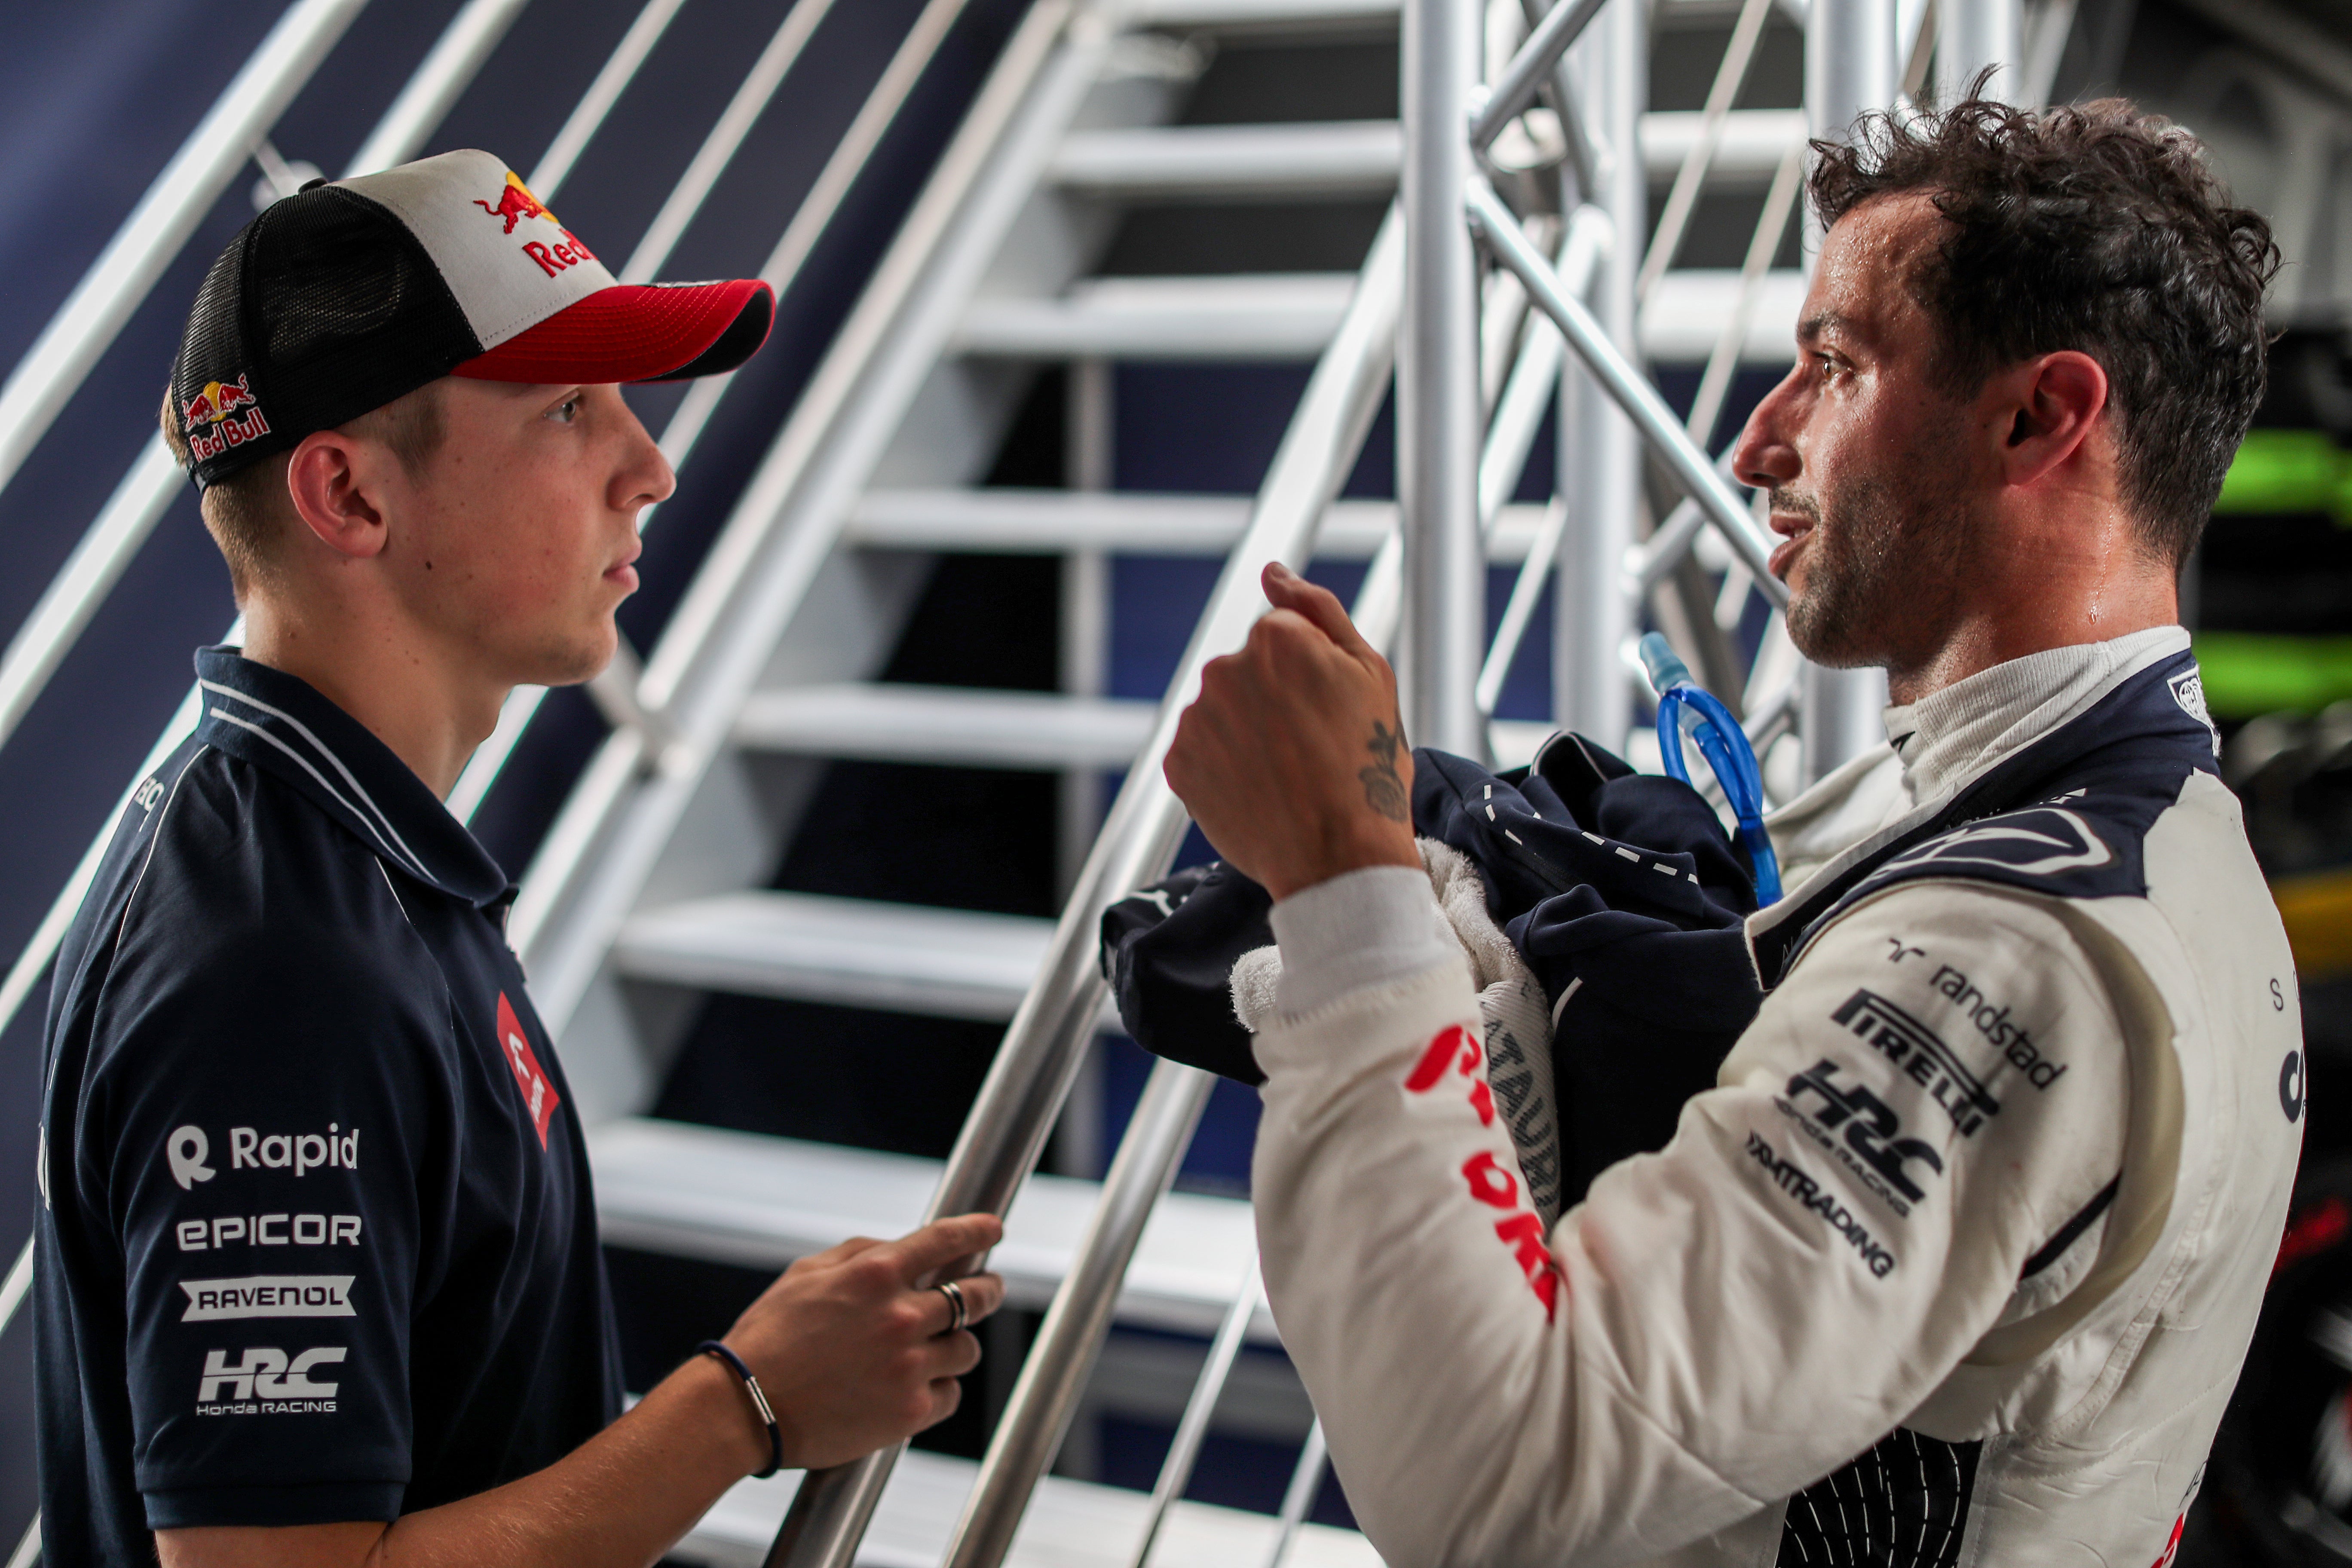
Take it with a grain of salt. There wasn’t enough to really include Daniel because he only participated in 7 Grand Prix, of which only 4 were counting races, of which only 2 were uneffected for him. That’s why you should take it with a cup of salt when I say, that Ricciardo’s delta to Tsunoda seems to be in the right window, suggesting him being back to his old self. But actually take it with a shovel or two of salt because over such a small sample size Alpha Tauri’s observable incompetence could also easily skew the results.
Unfortunately, there wasn’t anything to work with coming from Liam Lawson’s stint, as the universe seemed to conspire against the possibility of both Yuki and Lawson having a clean race together.
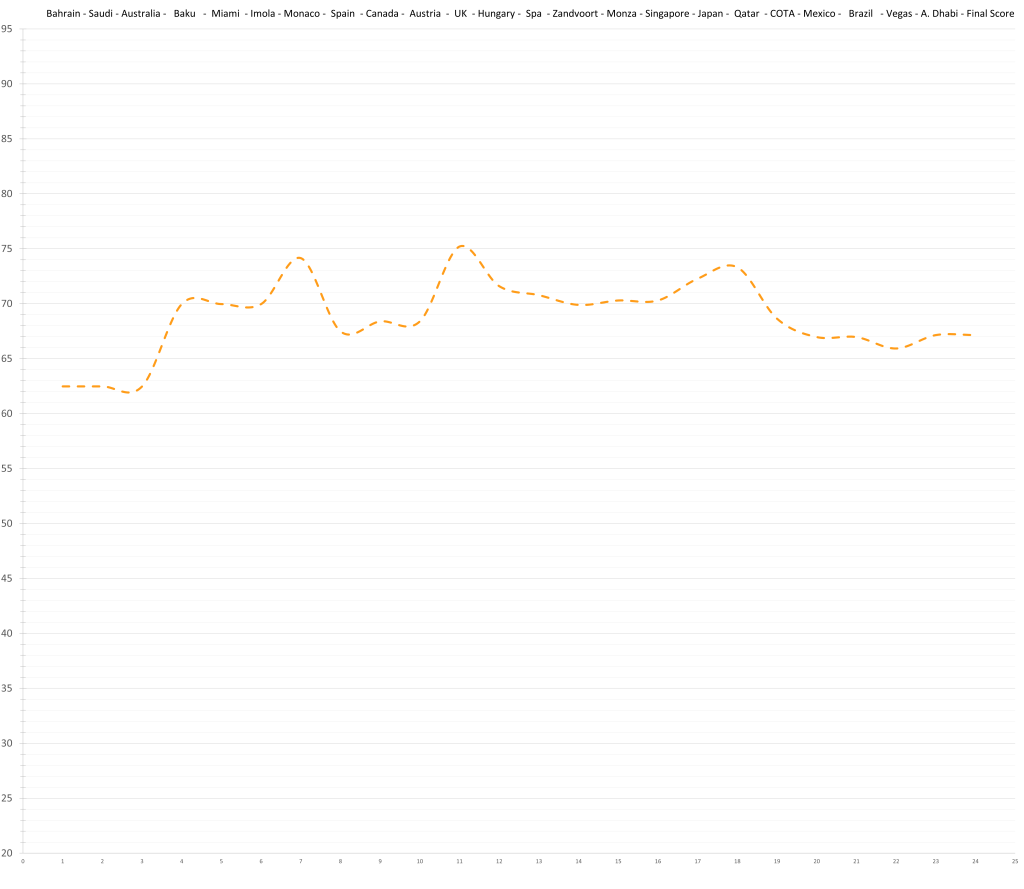
12 – Oscar Piastri – 67.1 (76.0)
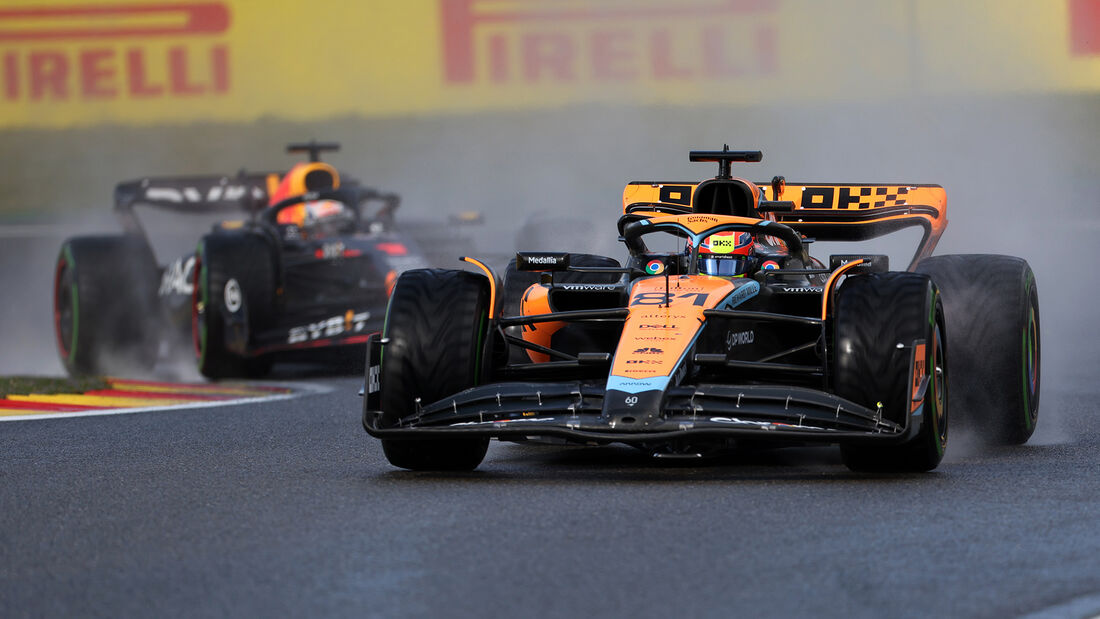
I think that Piastri’s rookie season gets generally overrated, because he had the best car of any Rookie since Lewis Hamilton. His season was still good but not extraordinary. Especially the Americas were not exactly Oscar’s favourite race ground. Before, he was on course to be competitive with Hamilton’s and Leclerc’s rookie seasons. Then he lost a lot between Austin and Las Vegas and while it might be a coincidence, it is at least worth mentioning that the sheer length of this Formula 1 season is simply nothing he ever experienced before.
Because the expression “for a rookie” always enters the conversation in such lists, I decided to adjust his score for experience (but not for age). This would put him towards the top of the next cluster of drivers, around 78 (ranked 8th). Personally I don’t see anything of use in that. To round this off, however, I did the same with Verstappen and Leclerc’s rookie seasons. Verstappen, who ranks 6th in 2015 would jump up to 3rd around 83, and Leclerc rises from 5th to 3rd (~85). I dislike this line of thinking because it doesn’t really tell you anything; not even how impressive the driver was considering circumstances. For that you would have to adjust for age too and also do this across the whole grid. What does become obvious from this little exercise is how drastically improved the quality density has become in just a few years. For comparison: Oscar would have ranked 10th in 2018, and even 7th in 2015.
One thing that was very impressive about Piastri this year was his incredible consistency. Next to no outliers are not common for rookies. This allows for an already quite narrow range for his predicted ceiling, which is now considered just shy of Norris. This promises an immensly talented quartet of drivers, all in their prime together on the grid, in a few years.
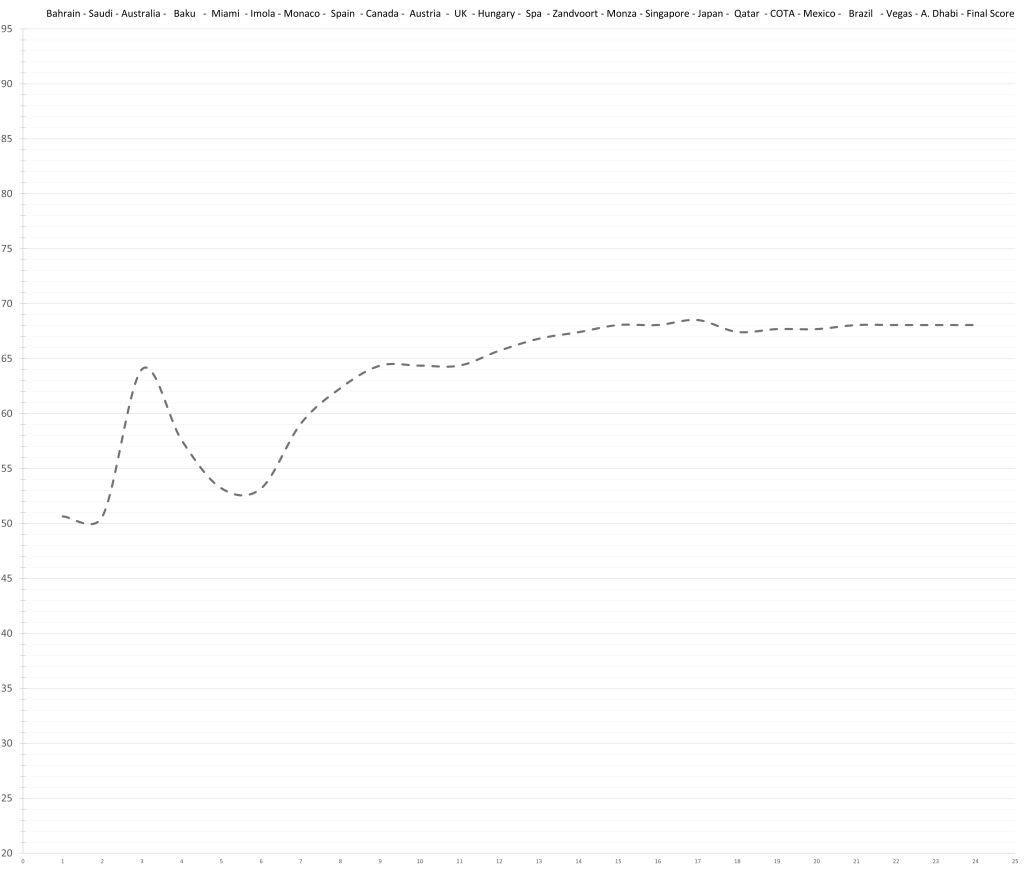
11 – Nico Hulkenberg – 68.1 (72.1)
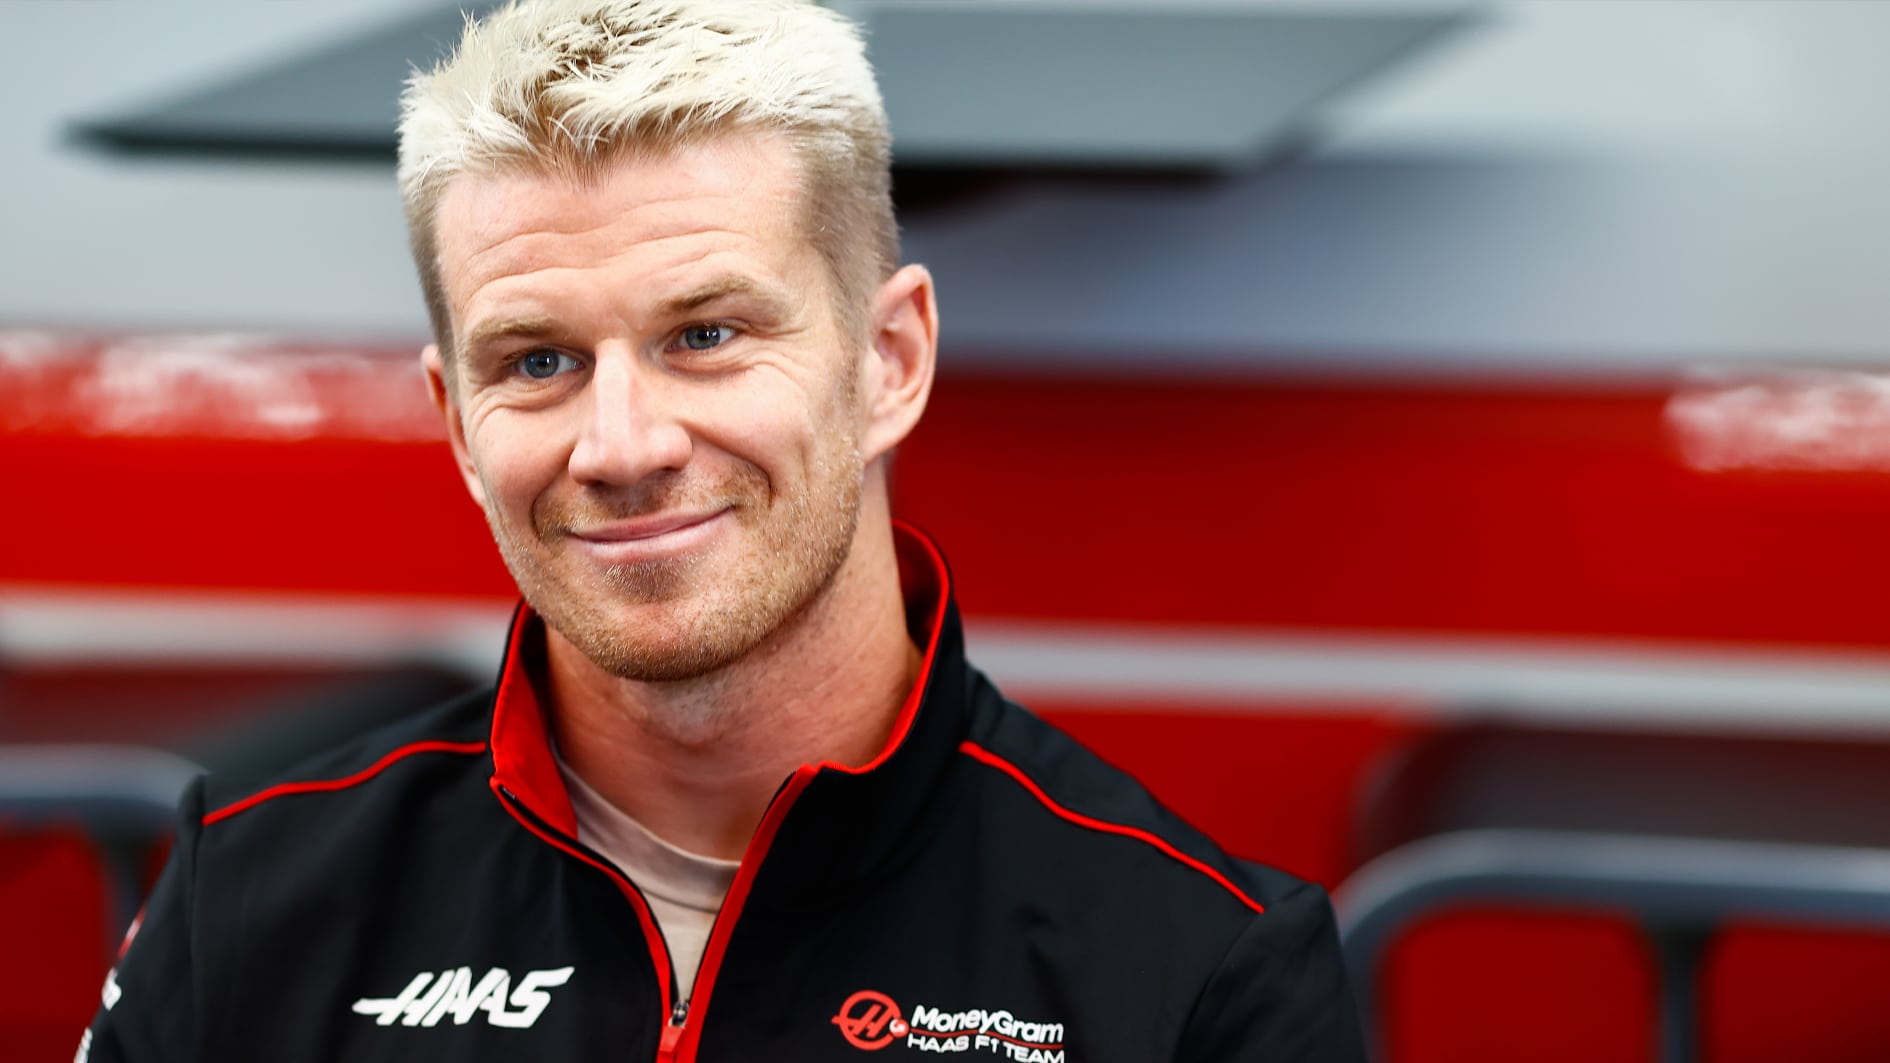
A frustrating season for Nico Hulkenberg. Every Sunday he only went backwards. That can’t be fun for long (if ever), but it’s his own fault; shouldn’t have qualified that high. Some people threw his hat in the ring for the second Red Bull seat and while his driving style alone would make him a way better fit than Checo, he is already 36 years old and will inevitably decline further. As Red Bull you would probably want the best possible driver that shares similar set-up preferences to Verstappen but can’t challenge Max. That driver is further up the list.
The “Good Ones”
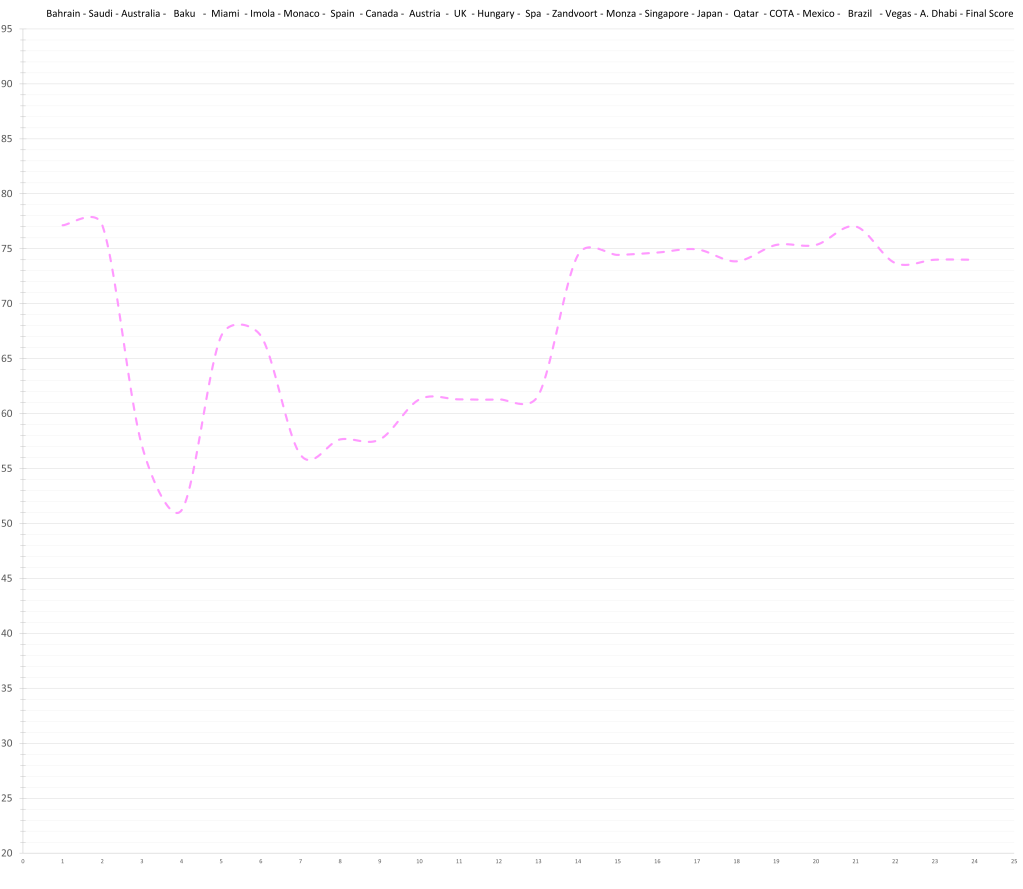
10 – Pierre Gasly – 74.0 (80.2)
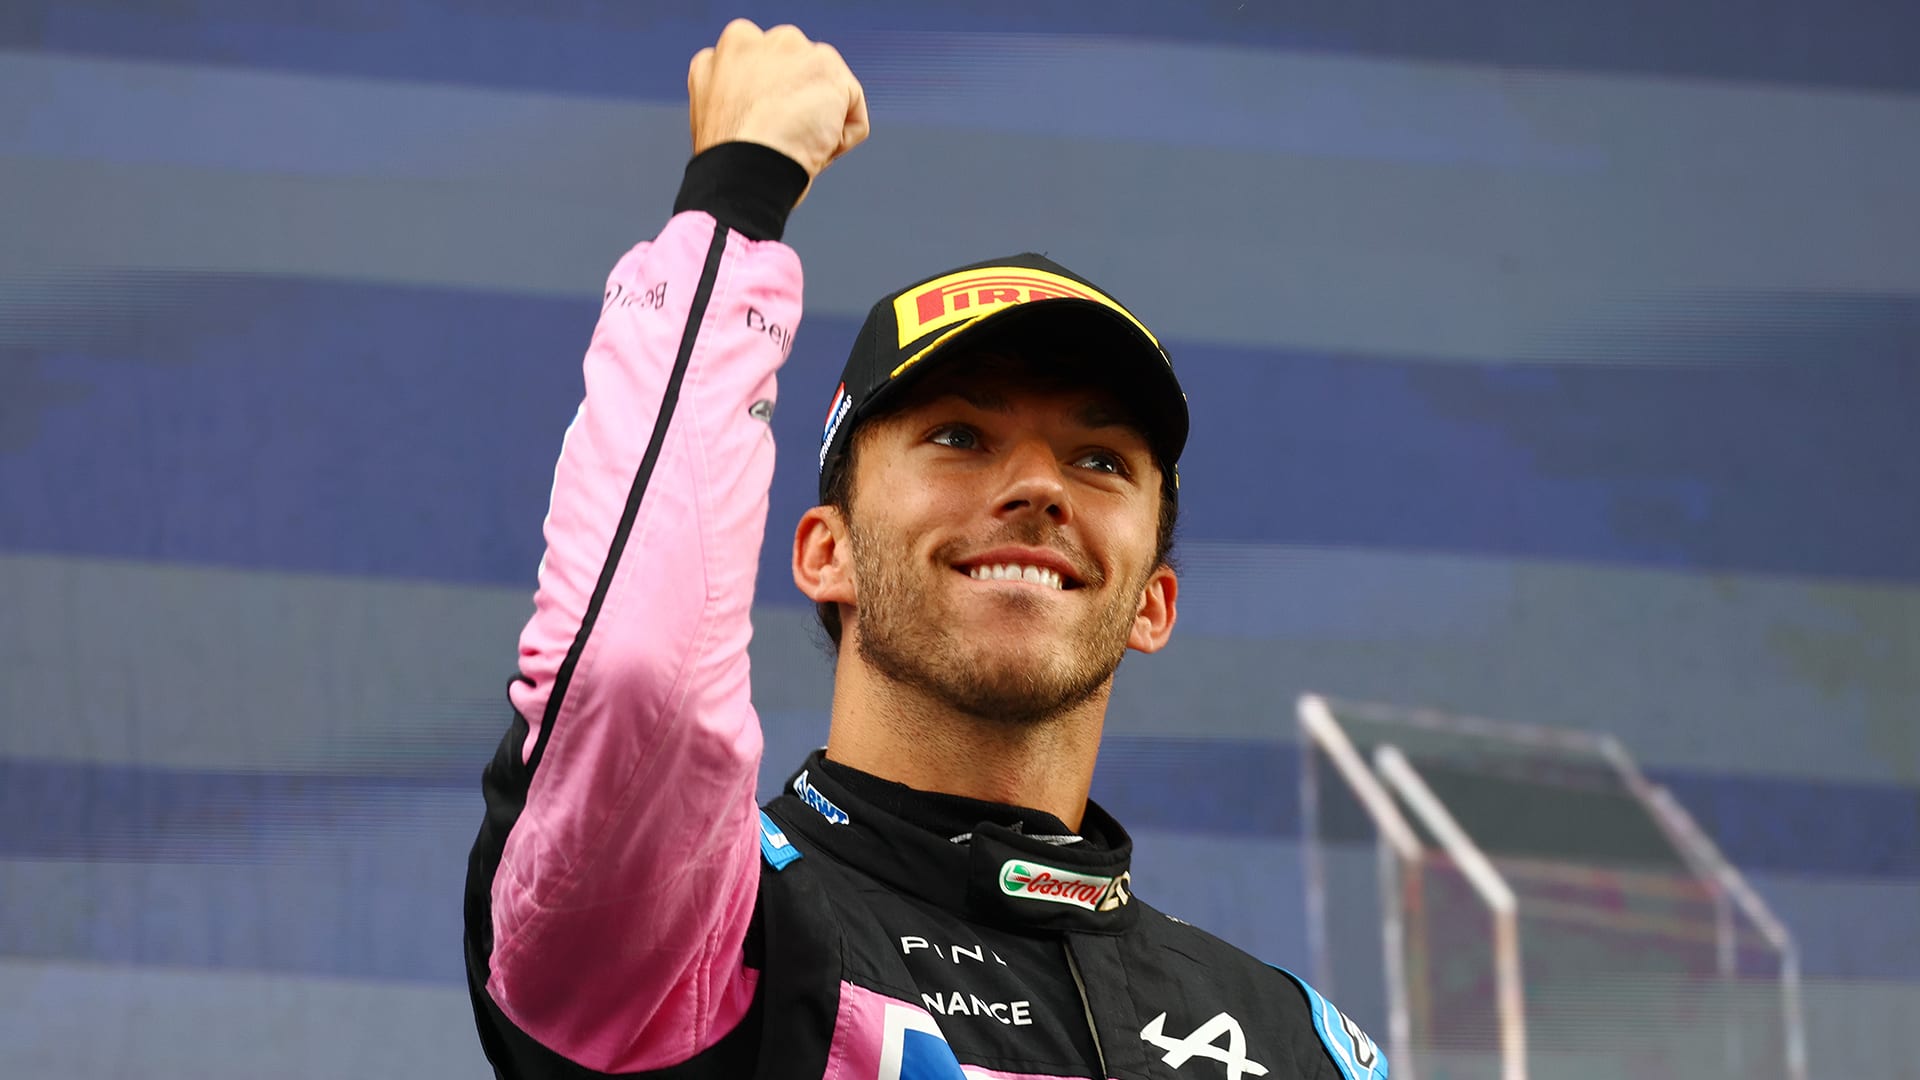
Gasly made the expected climb after an unlucky first half of the season. Unexpectedly, he did so by immediately driving to 3rd in Zandvoort. From there on out the Alpine drivers were almost inseperable in the models ratings. Gasly seems to have a preference for qualifying like Nico Hulkenberg or Rosberg. Towards the end of the season Pierre had the measure of his teammate in qualifying, whereas the race results don’t express the same trend; Gasly loses 6-9 in counting races.
9 – Carlos Sainz – 76.3 (83.2)
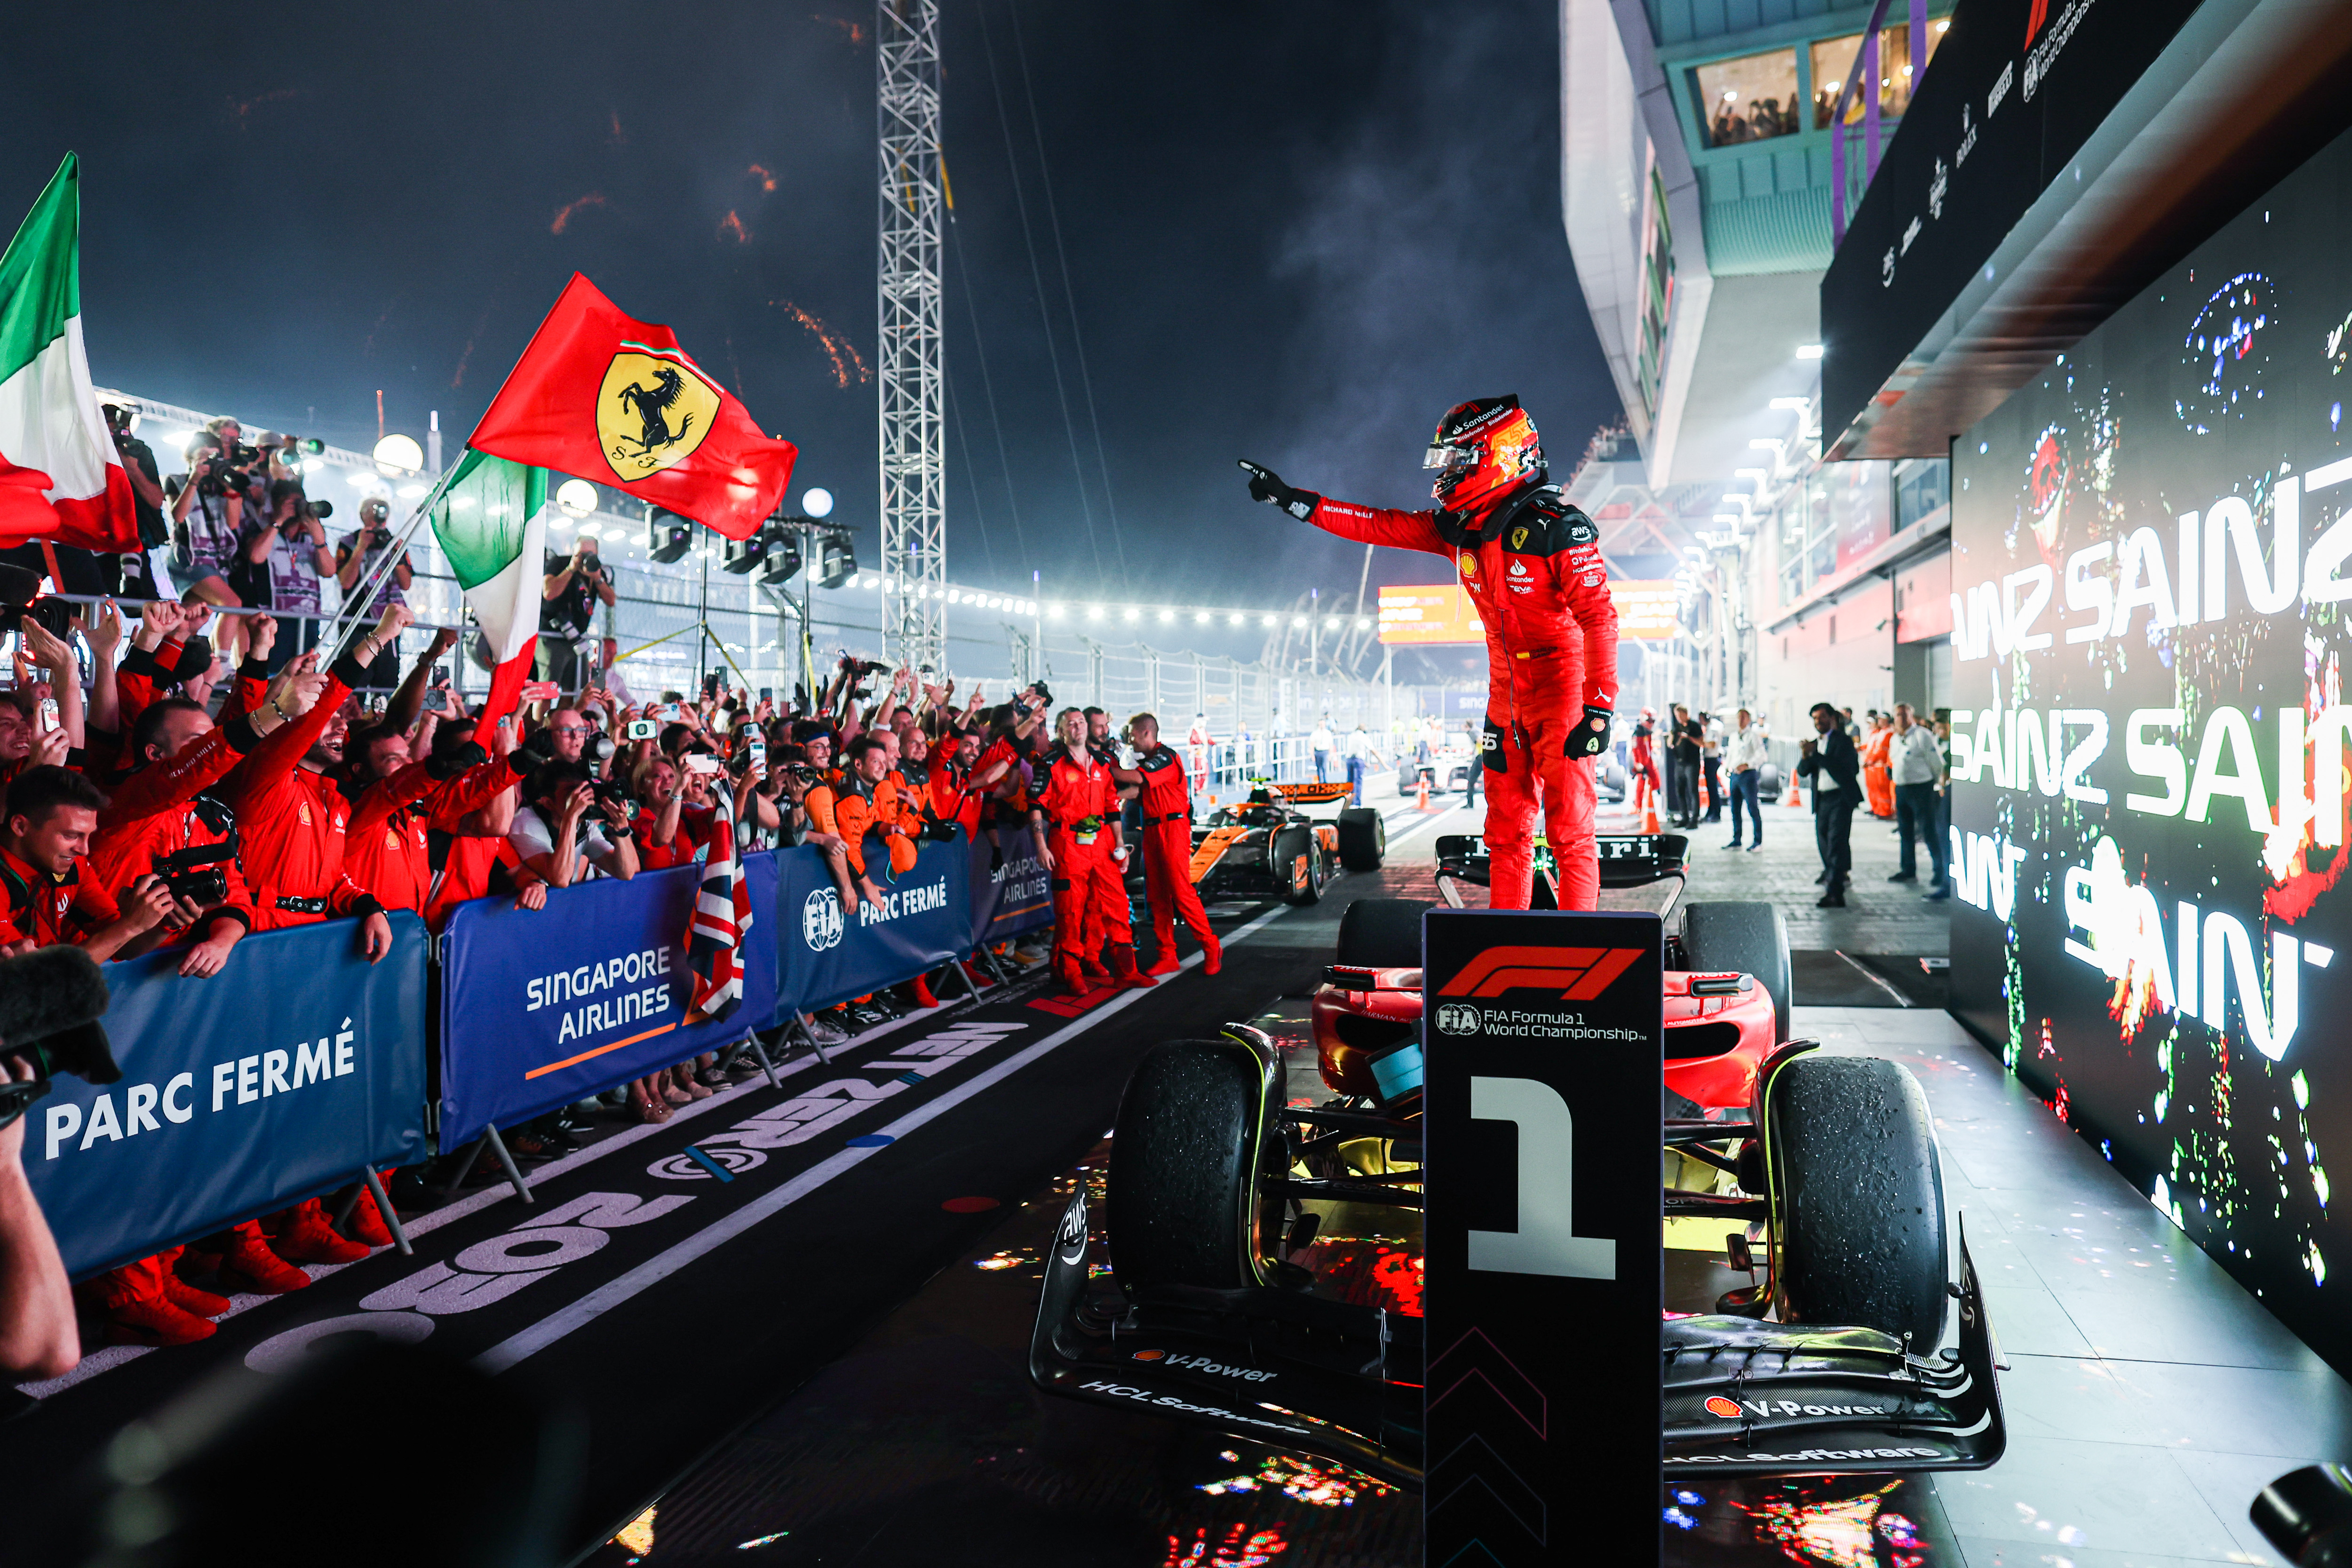
The only non-RB winner, Carlos drove a wonderful Singapore Grand Prix and Italian Grand Prix before that. Apart from those two races, as bright as they may be, he didn’t really have any other highlights. The rest of the season was riddled with minor and major grievances resulting in a record of 6-12 in counting races. Of course 2023 is still a step up from 2022, and especially the 2nd half showed a general upwards trend, but there is some room for improvement. This was a far cry from the Carlos Sainz of 2019-2021 that earned back to back to back top 5 performances from the model through sheer consistency.

8 – Esteban Ocon – 77.0 (81.4)
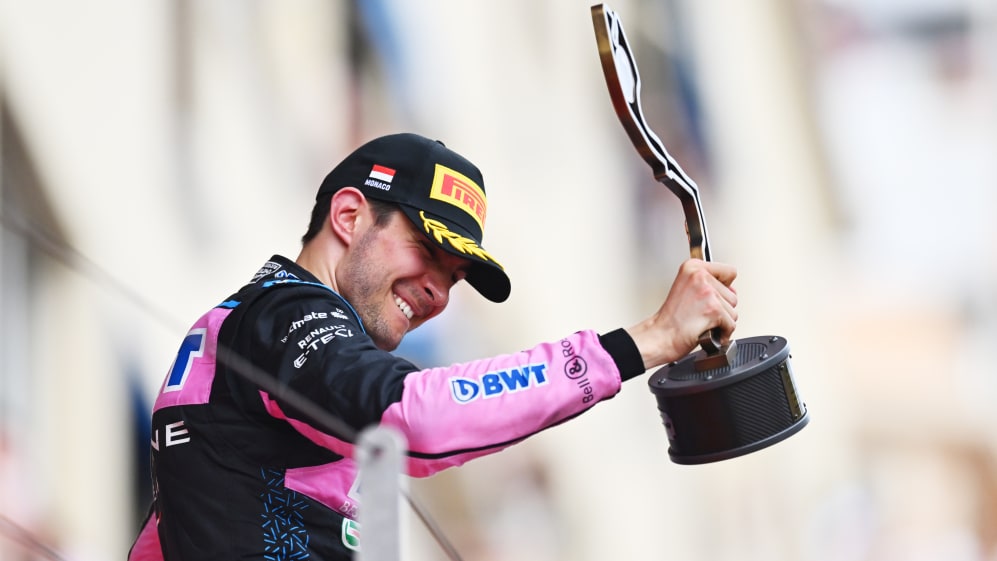
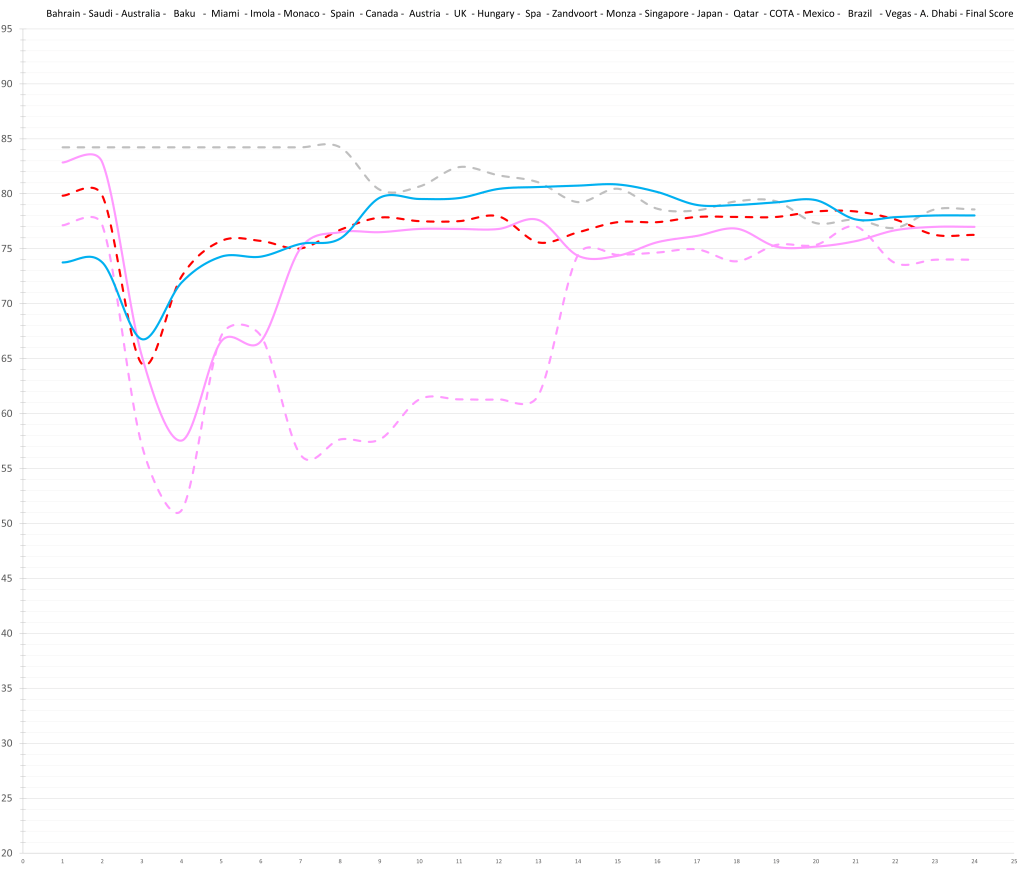
Alpine had the closest driver pairing of the season. While the model finds Ocon to hold a small advantage concerning their ceilings, in the actual ratings it’s close to a coin flip. The biggest difference this year was that Ocon (ironicly, given 2022) clearly outdid his teammate in having mechanical issues. With these two Alpine have a pair of really good drivers, but none of them are exceptional; they are perfect for a midfield team.
7 – Alexander Albon – 78.0 (82.1)

Until Albon is paired with a driver that can deliver any further information, his ratings will be based on a mixed 1.5 year stint against Verstappen (which, at this point, ended already 3 years ago), half of a season against Kvyat, and the assumption of standard developement through age and experience. That should by no means be understood as Albon being categorically rated falsely. He might well be rated exactly right but his rating has a way higher degree of uncertainty compared to most other drivers on the grid.
In Hulkenberg’s entry I alluded to the perfect driver for the second Red Bull seat. I meant Albon. Most importantly, he likes a strong front end. He is also about as good as it gets for a driver that doesn’t challenge Verstappen. The expected delta between Verstappen and Albon would only be slightly smaller than that between Senna and Berger, or Hamilton and Bottas. If you go any higher for the second driver, you would run the risk of getting someone that occasionally steals points from Max or hinders him. Unfortunately for RB, Albon lacks the final ingredient of their perfect No.2: wanting that seat.
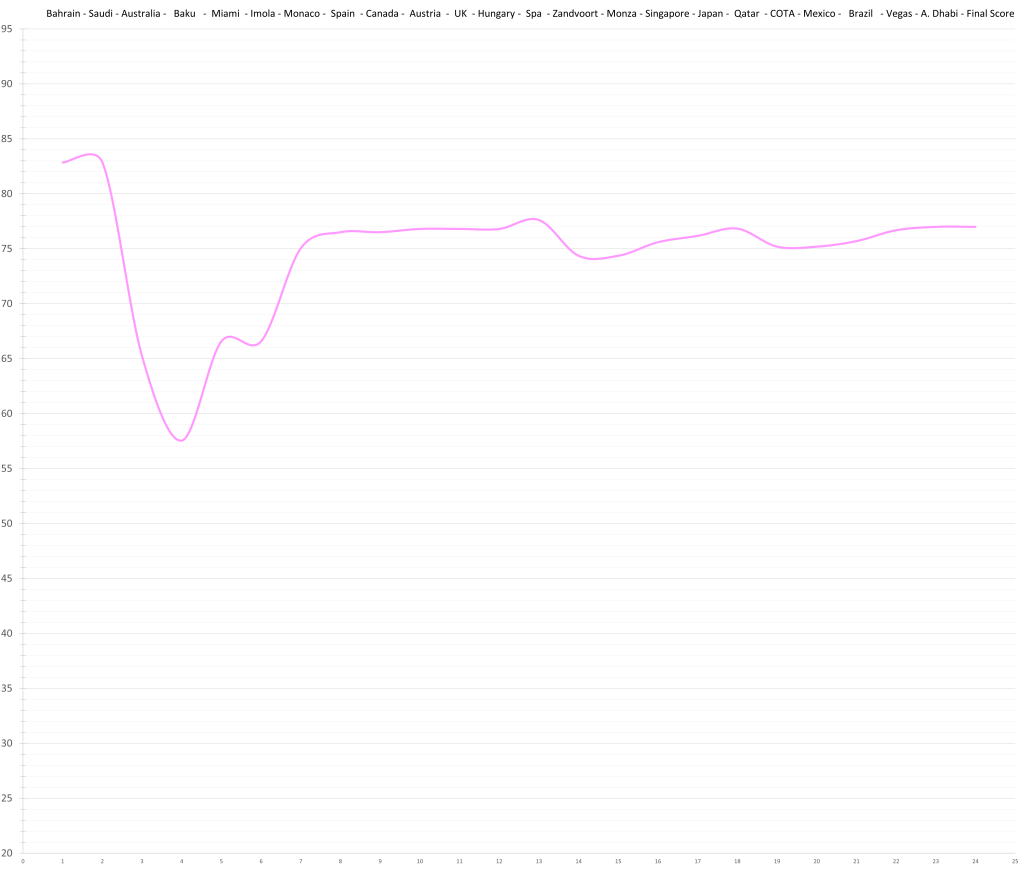
6 – George Russell – 78.6 (84.2)
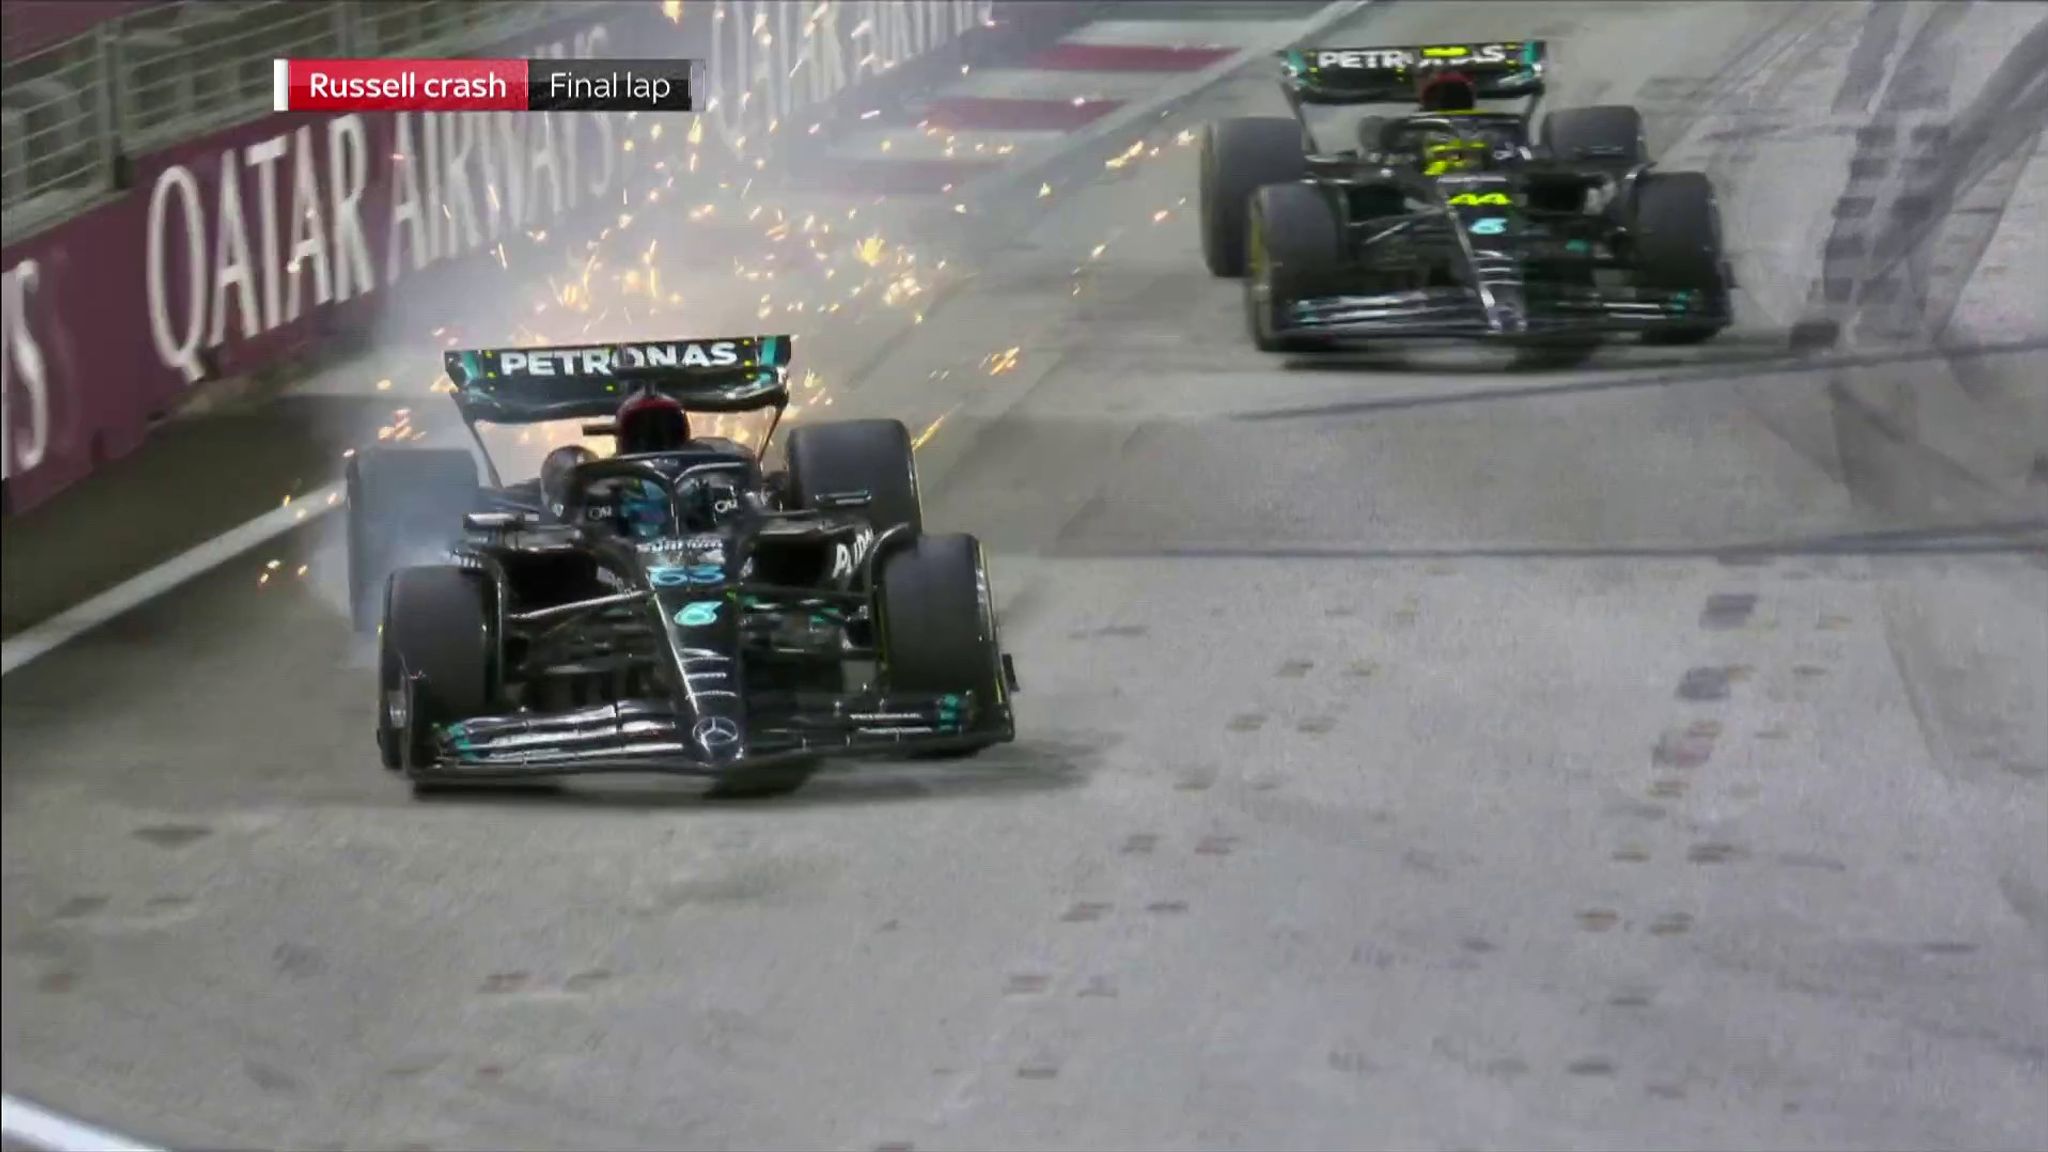
Starting in Canada, Russell’s season built up some downward momentum and never reallly stopped. His delta to Hamilton was as expected, meaning that his whole deficit stemms from off-weekends and of course stupidly ruined on-weekends. Looking back at 2022, this shouldn’t have been all that surprising. He got away with a lot of collisions not affecting his races and it seems that luck ran out. For next year Russell is expected by the model to be pretty much equal to Hamilton on pace, but if he wants to be competitive with his teammate in the standings, he needs to calm down.
The “Race For Second”
5 – Lando Norris – 82.0 (87.5)
For a majority of 2023 it looked like second was on the table for Norris, but towards the end of the season he somewhat lost his rhythm. The turbulence came through some over ambitious quali antics and then an unfortunate crash on lap 2 in Vegas.
Throughout the season some voices got loud calling Piastri a problem for Norris. Some even went as far as calling Piastri already equal to Lando. While they were evidently wrong, it sparks an interesting question: When will Piastri be able to challenge Norris regularly. Thanks to his very tidy season, Oscar’s range is already very narrow, allowing the model to make some (hopefully correct) projections. From the diagramm below it becomes apparent that in all likelyhood Piastri won’t beat Norris over a season on pace before 2026, but he is aslo projected to surpass Lando eventually. From 2025 onwards the model sees them as an incredibly close match-up and potentially one of the greatest pairings of all time (if they are still teammates by then).
The above (and complementary diagram below) were the original assessment. With further information, Oscar is not expected to have a higher ceiling than Norris anymore.
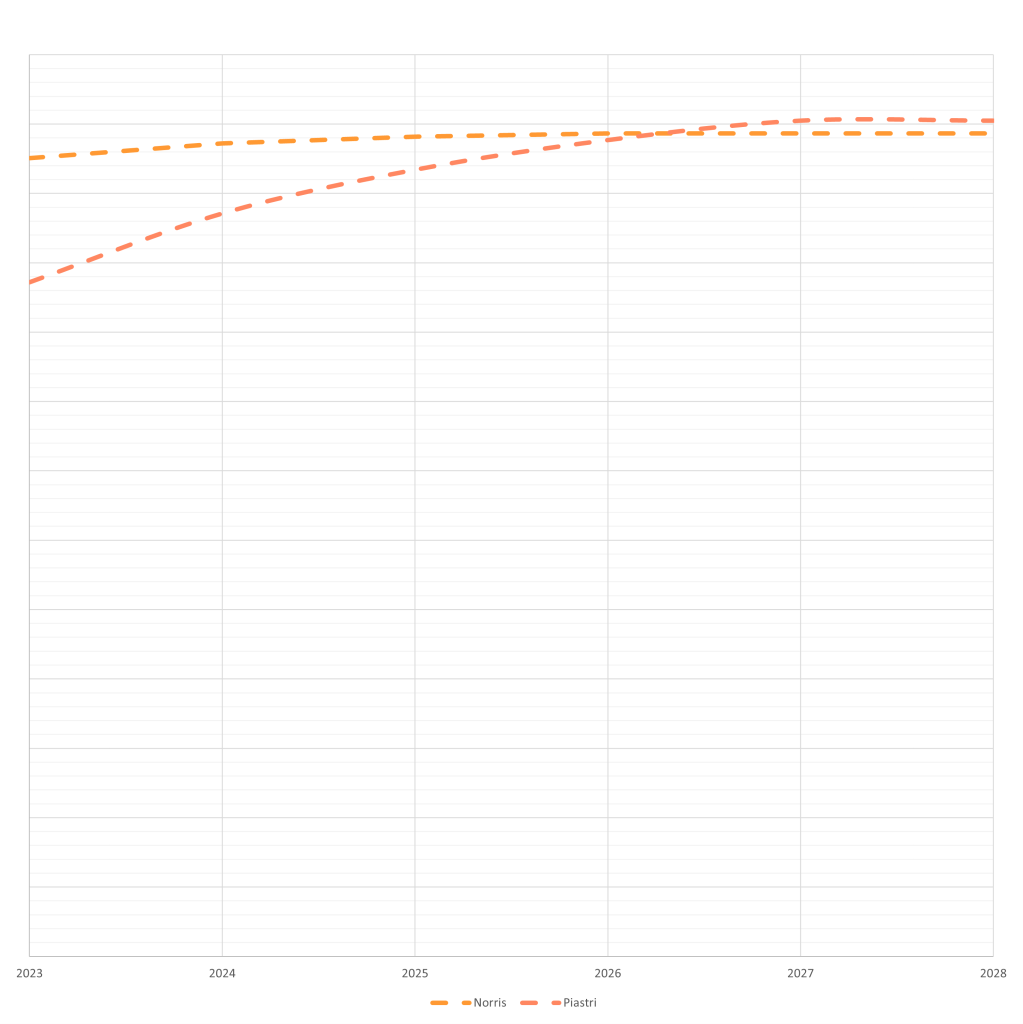
“But Oscar is already matching Norris in qualifying!”, I hear you say. Well, quali-pace seems to be uneffected (or only to a very small degree) by a drivers experience, but to evolve with age. If this is true, the gap in qualifying between the two should stay roughly the same over the next two seasons, after which Piastri is going to catch up. At this point that is only a hypothesis based on what I’ve seen in the data without an extensive analysis backing it up. Additionally drivers vary in their preferred set-up favouring either race or qualifying (e.g. Verstappen vs. Rosberg).

4 – Fernando Alonso – 83.6 (84.9)
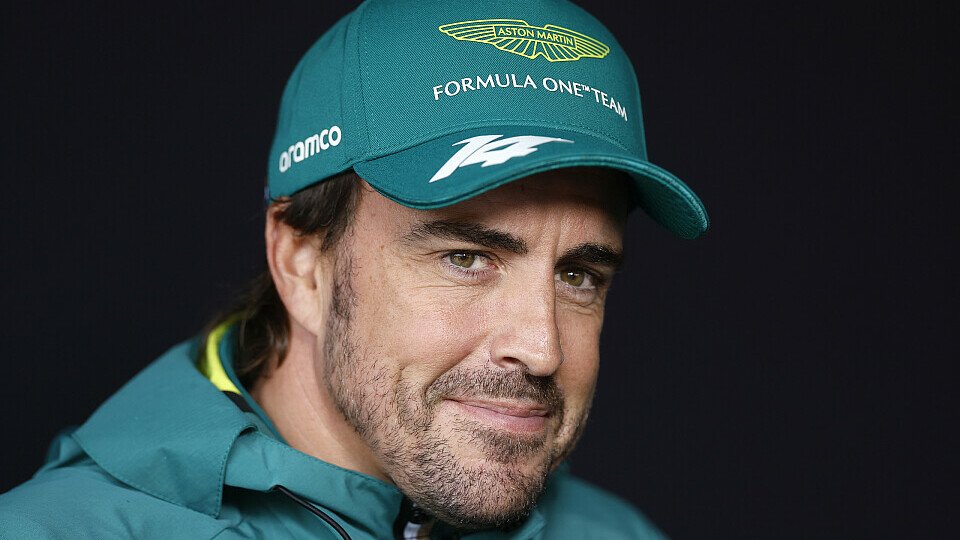
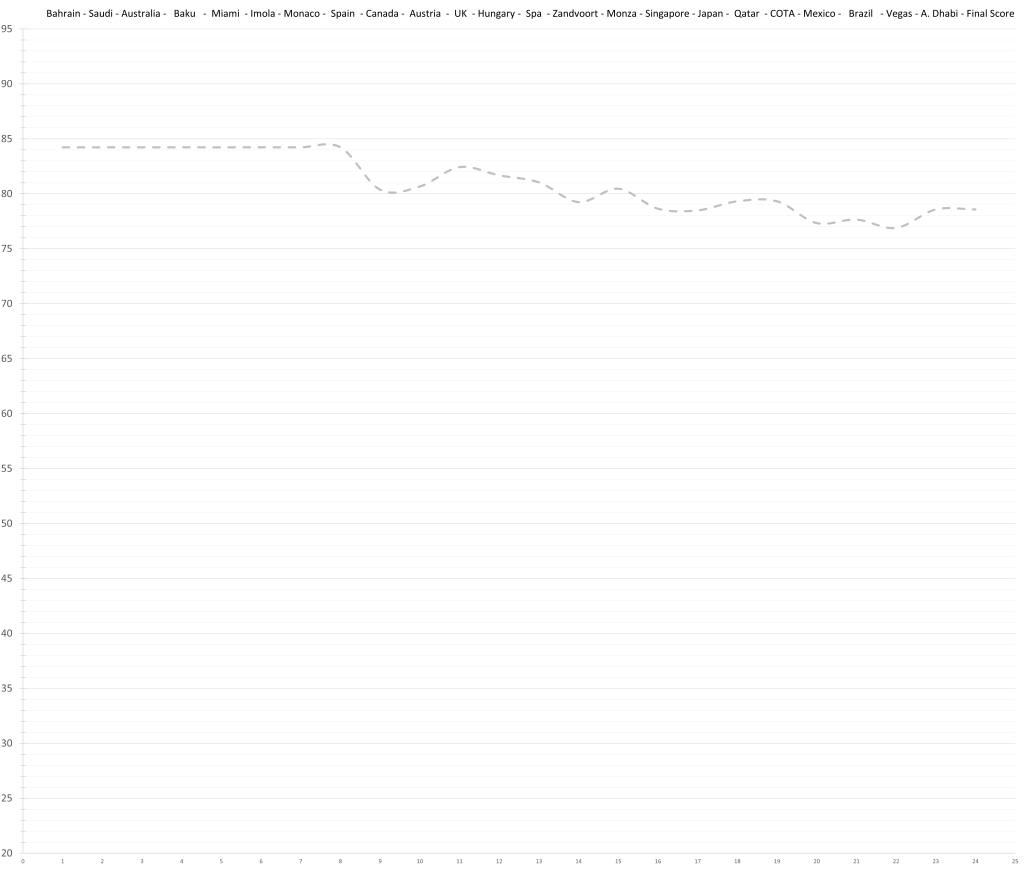
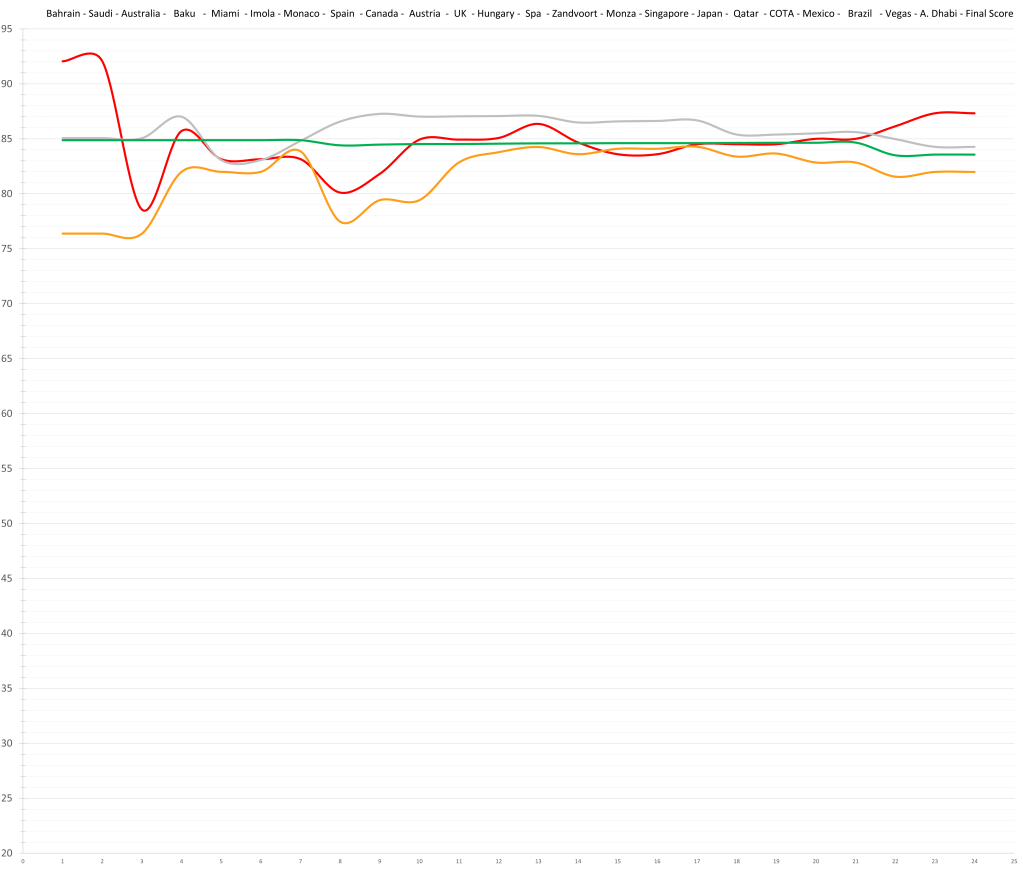
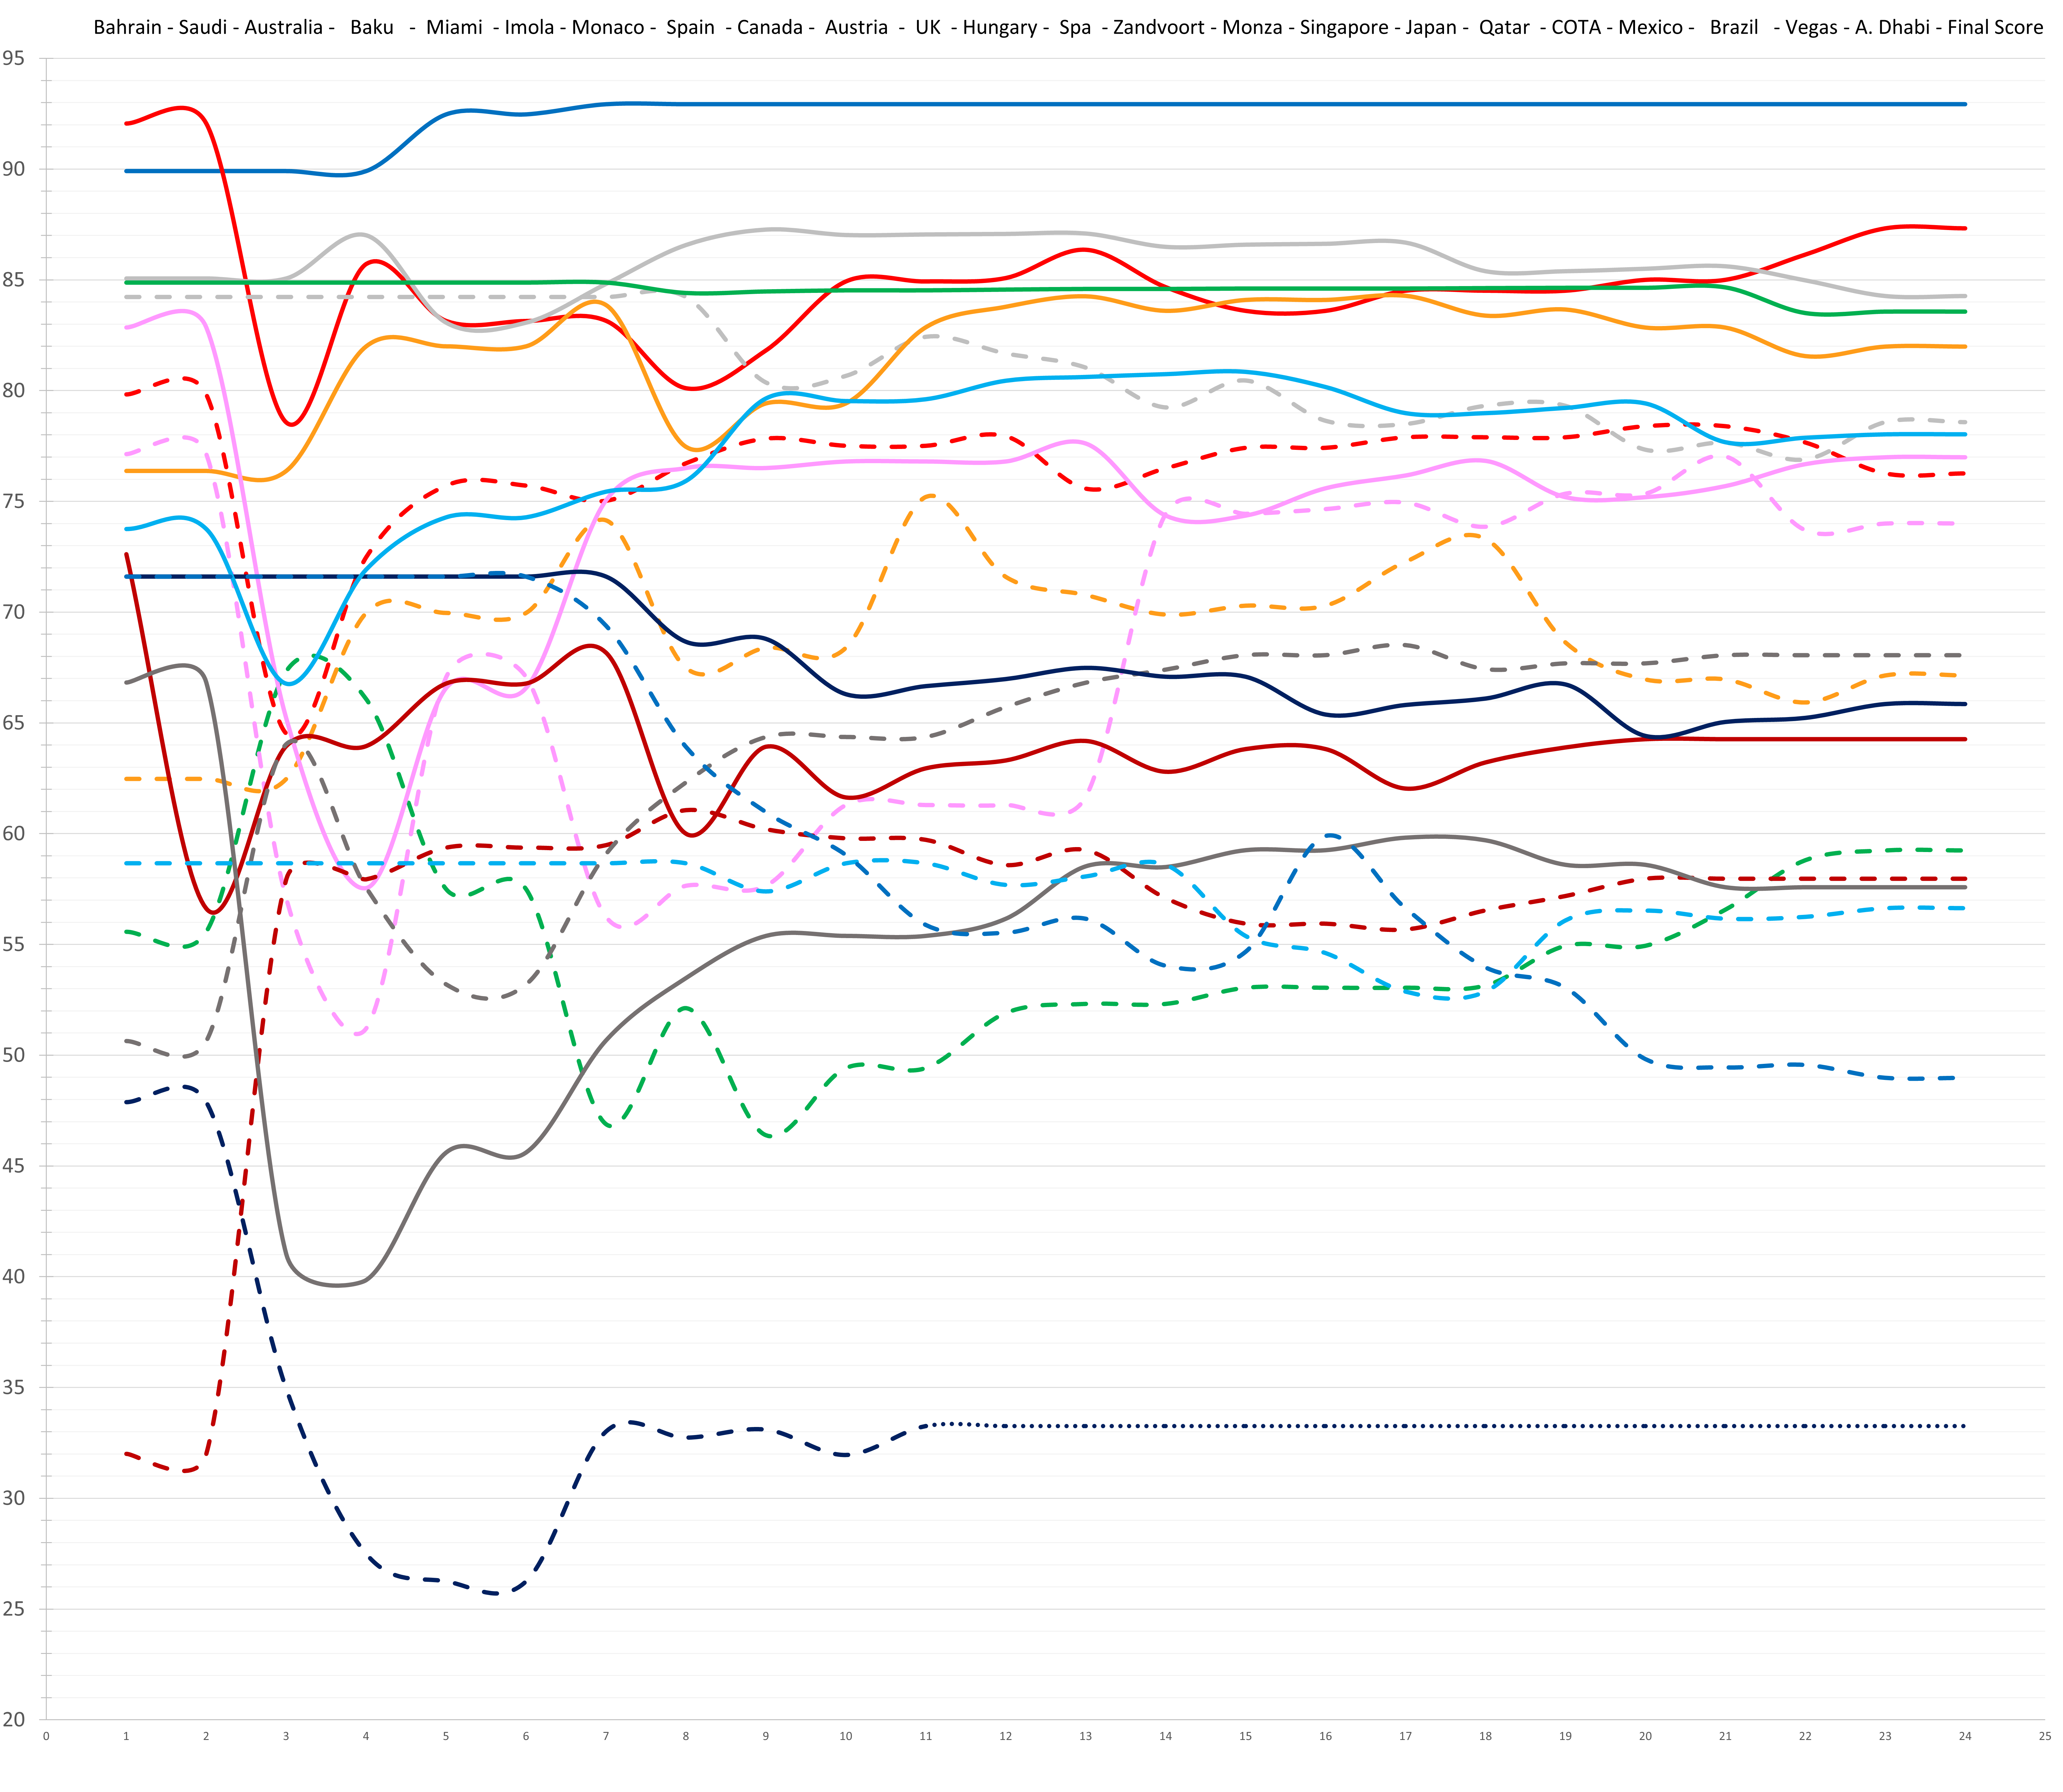
The race for second, frankly, ended in a draw. The 4 participating drivers are rated so closely after Abu Dhabi that they are all well within uncertainty of each other, which is also a reason I call these posts “season ratings” and not “season rankings”. It doesn’t matter who is 2nd and who is 5th. What matters is that they are all rated ~84. In the last decade 4 Championship seasons (2016, 2017, 2019, 2020) are rated lower than any driver of this group in 2023.
This is not quite the case anymore.
Is there anyting new that could be said about Fernando Alonso at this point? He absolutely demolished Stroll with a smile on his face. Alonso is obviously not in his prime anymore but all the more impressive for it.
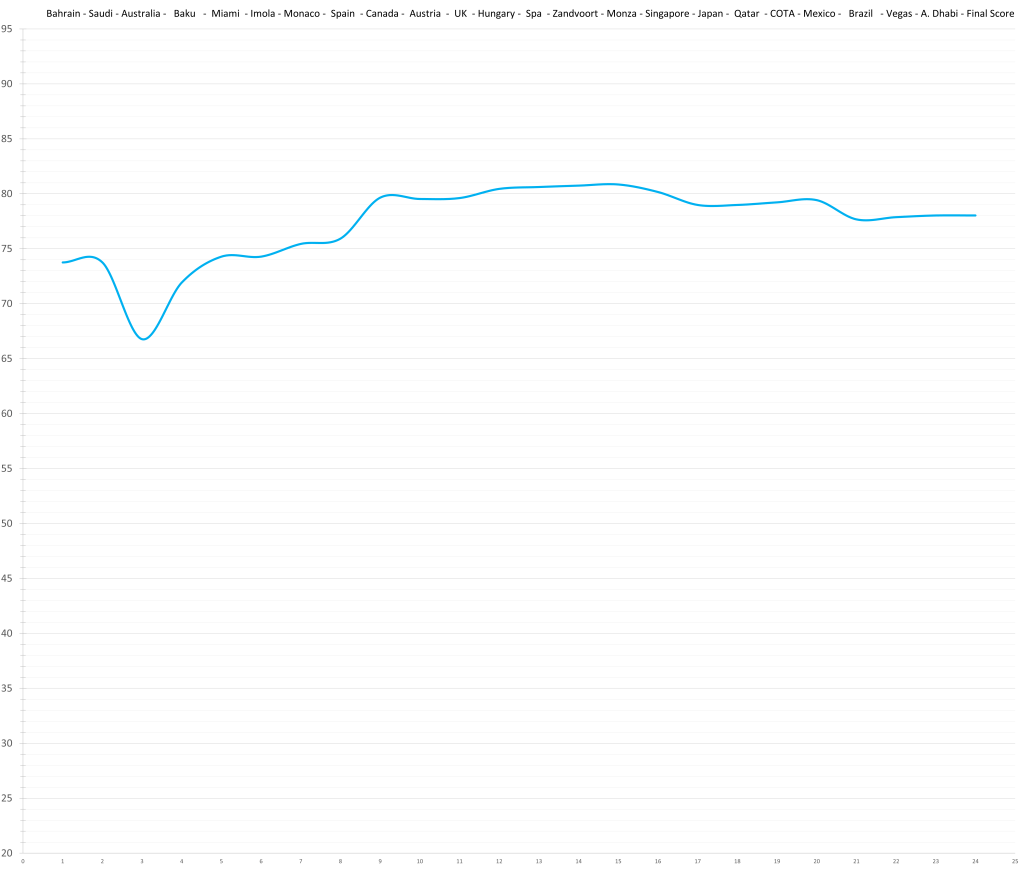
3 – Lewis Hamilton – 84.3 (87.3)
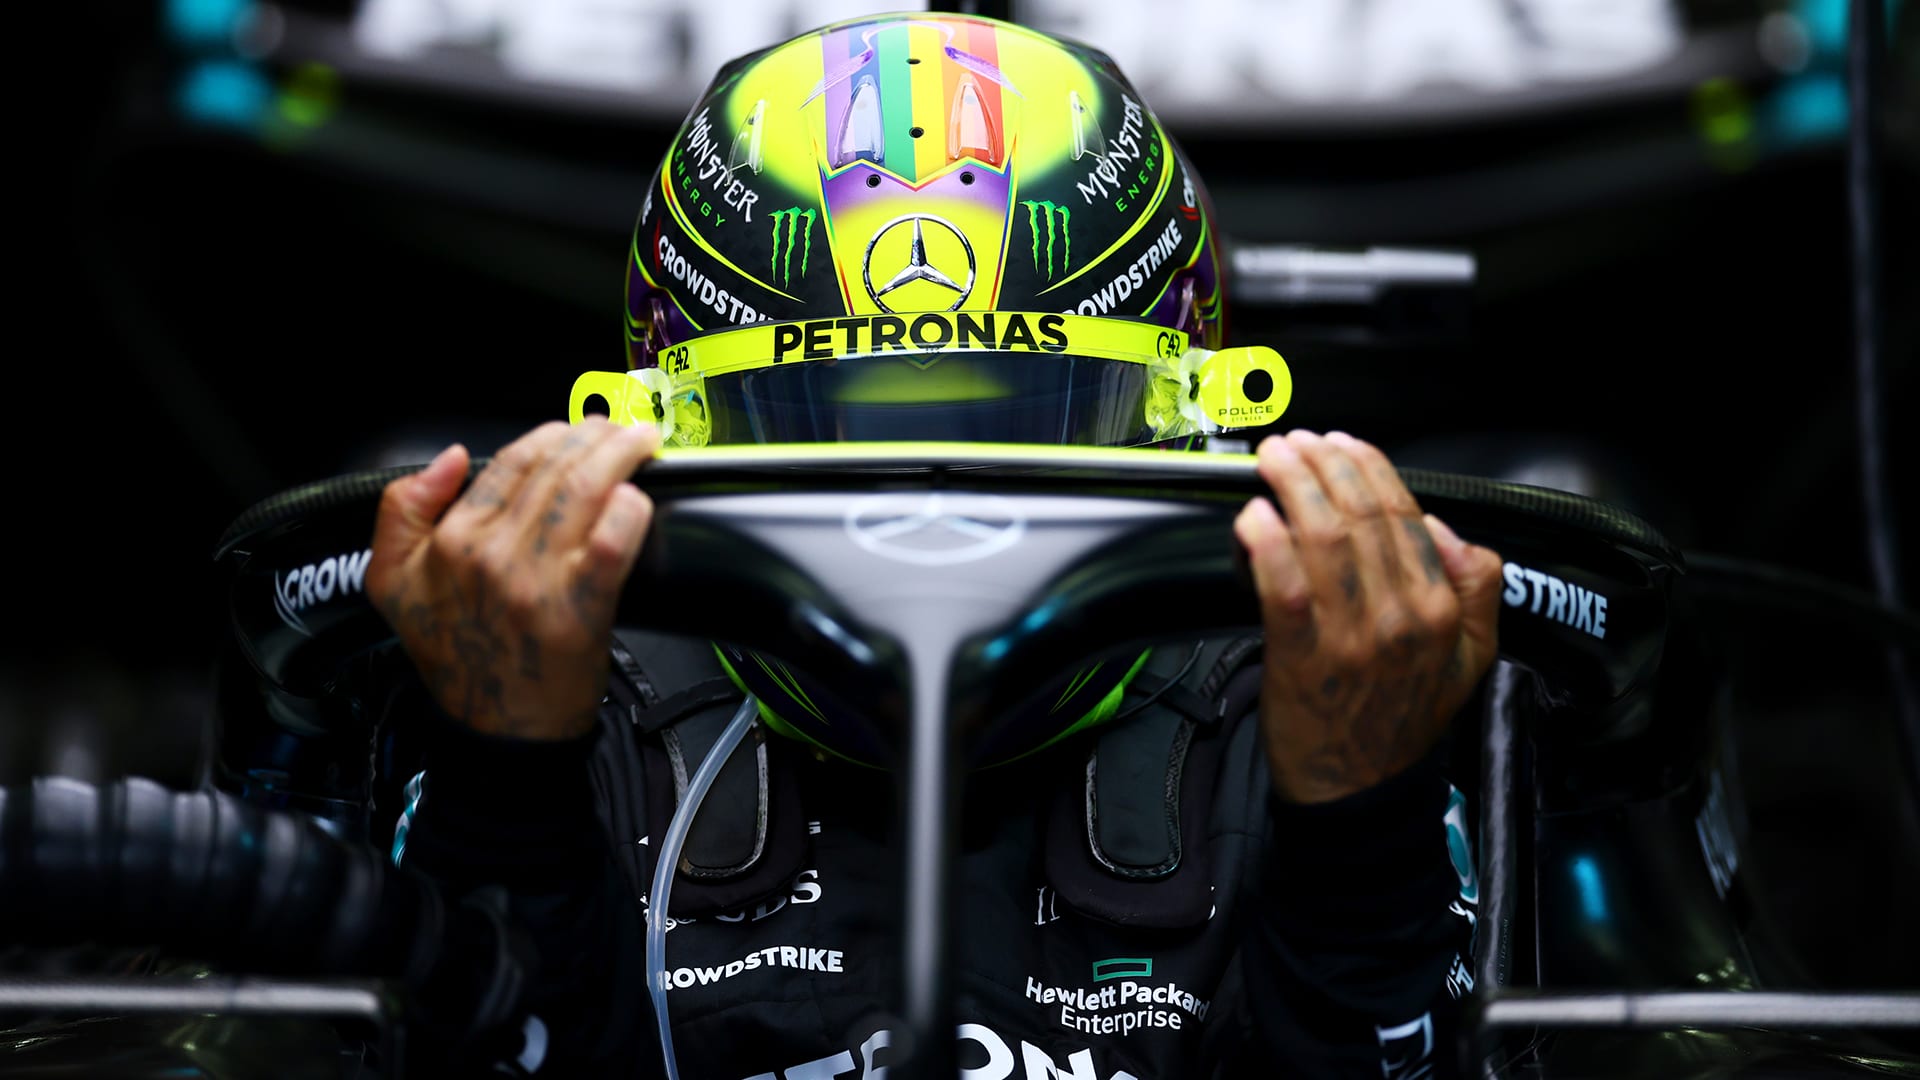
Hamilton beat his teammate 13-7 in counting races further cementing himself as the Number 1 at Mercedes. He upheld his trend of balancing out a decline in pace with a higher degree of consistency. This might help him stay ahead of Russell even when he starts outmatching Lewis on pace. These two will be very interesting, should Mercedes manage to deliver a competitive car in the next 2 years.

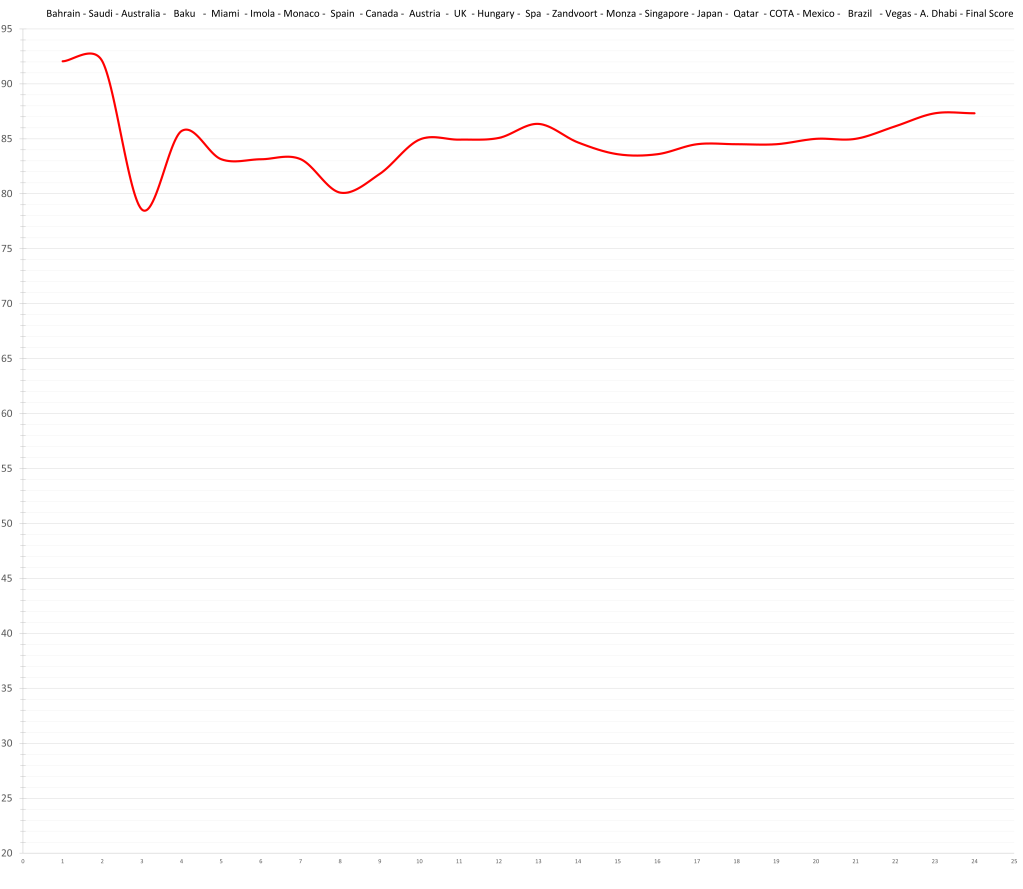
2 – Charles Leclerc – 87.3 (92.1)
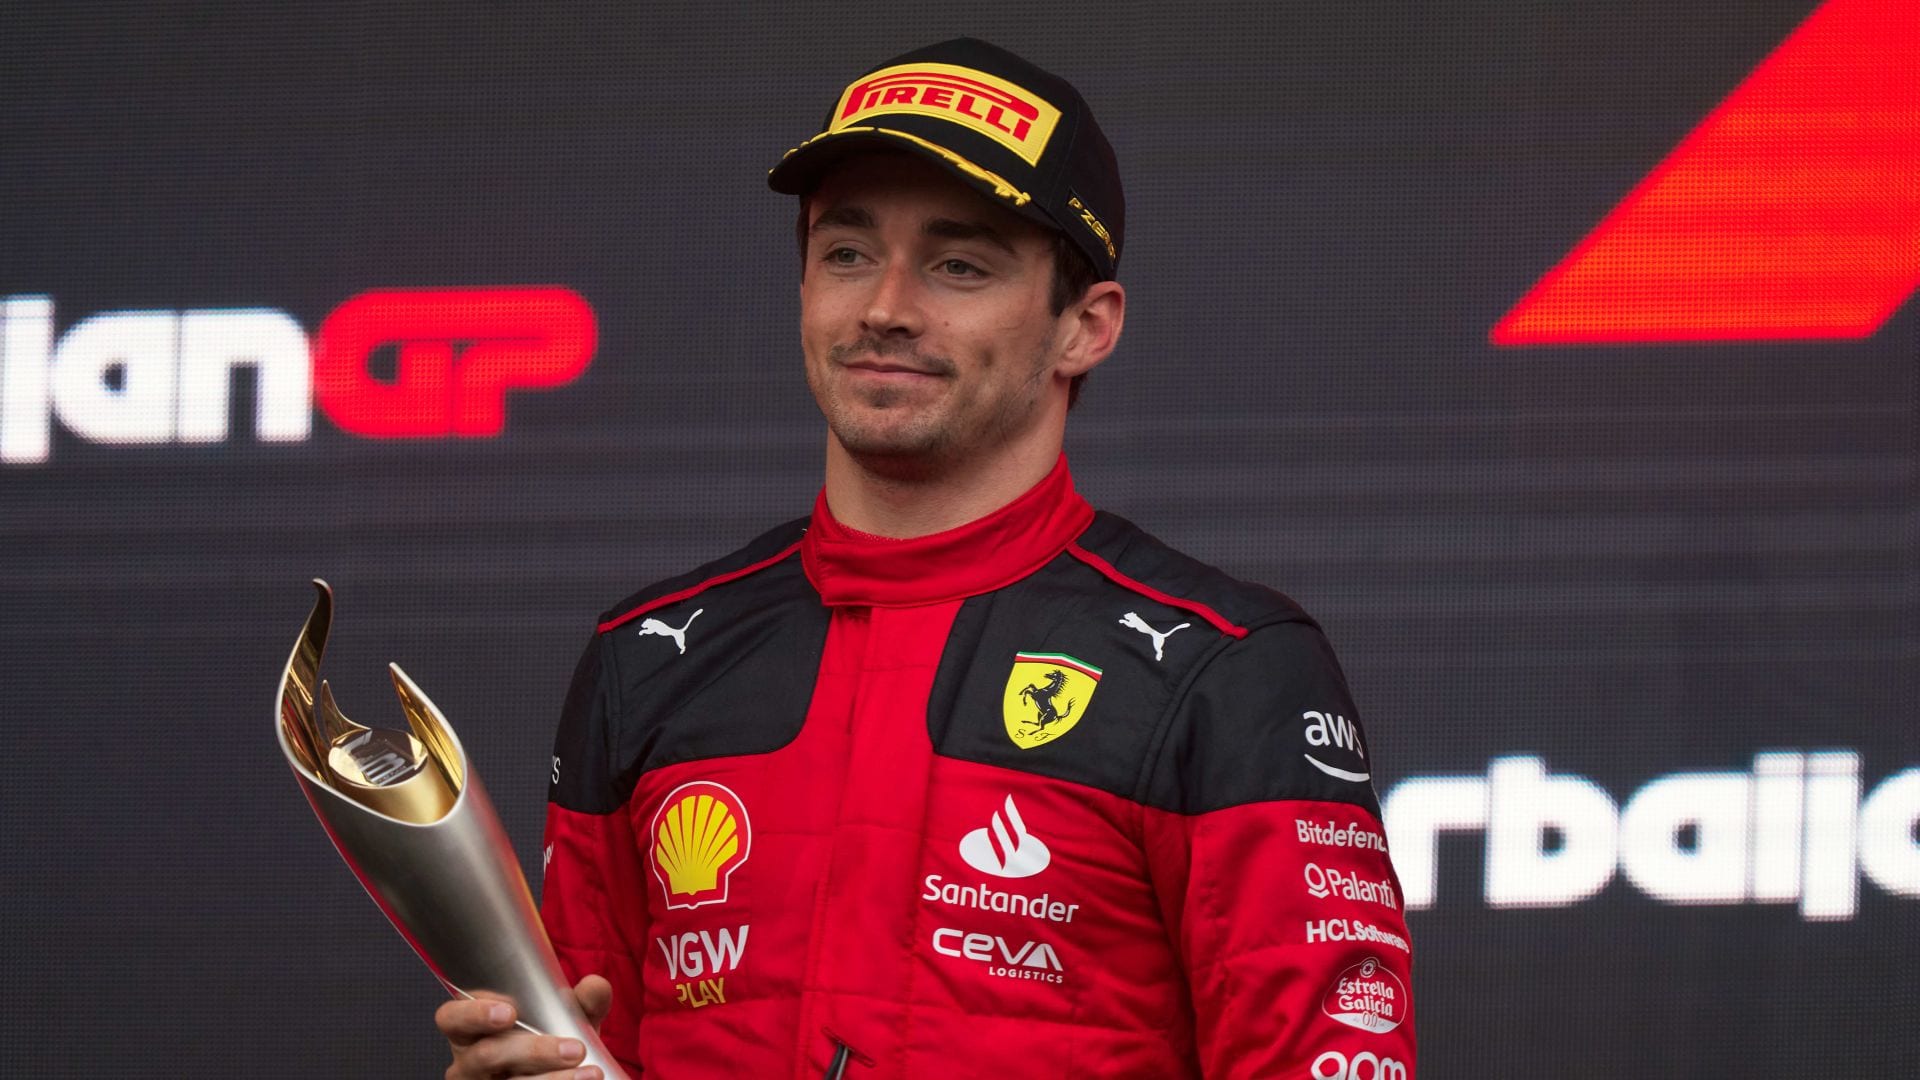
When people talk about Leclercs 2023 season, he is often described as mistake prone or that he had “too many off weekends”, from which all kinds of conclusions are drawn. This ranges from “Leclerc is not on the level of Hamilton and Alonso” all the way to “Sainz is the better Ferrari driver”. What these arguments fail to see is that basically every weekend he is on form, Charles leaves everyone but Max in the dust (hyperbolicly speaking). Leclerc was without a doubt the top driver with the most points left on the table, but a lot of his points wouldn’t even be on the table for anyone else. At the end of the day, Leclerc managed to be rated second after a very strong home stretch. However, it shouldn’t even be a contest. With the pace Charles has in hand over anyone not named Verstappen, it should not have been this close. He needs to be better, if there is any chance of fighting Max Verstappen and Red Bull in the future. To be fair, he was excellent after the Japan upgrade brought the car back to his liking.
I think it is really interesting that these 4 drivers are rated so closely after 22 races. What that means is, that under the same circumstances (including luck) they would have all scored nearly the same amount of points with completely different approaches. From the blistering speed, but relatively frequent off weekends of Charles Leclerc to the crushing consistency, but relatively weaker pace of 42 year old Fernando Alonso. Then there are Lewis Hamilton and Lando Norris who are on opposite sides of their respective careers but whose pace just so happen to be crossing over right now. All in all I think it is great that the 5 top drivers are in the 5 top cars. It’s the perfect set-up for a classic season – if the gaps to No.1 weren’t so big.
The “Maximum”
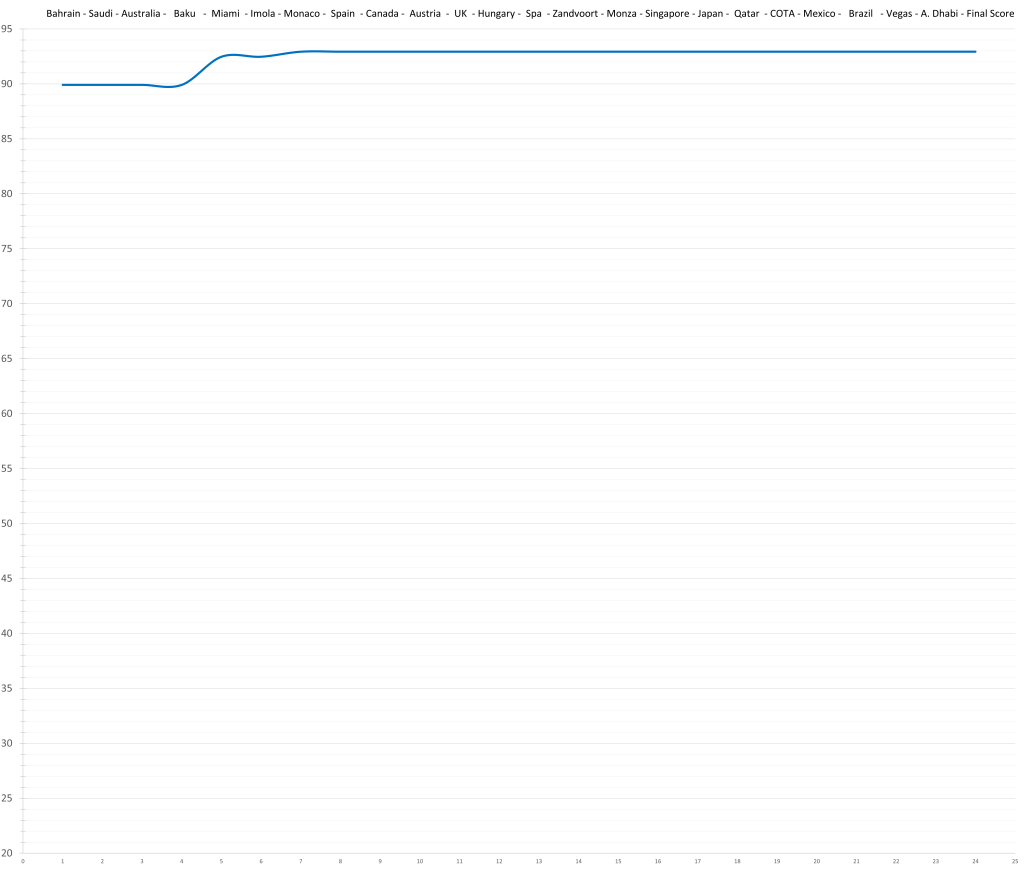
1 – Max Verstappen – 92.9 (92.9)
Since 1970 the model rates only 20 seasons above 90, only 12 of those above 91, and only 6 of those above 92. Verstappen now has one of them. The model rates only 2 seasons above 93 and Verstappen came closer than anyone without crossing that barrier. That makes his 2023 the 3rd highest rated season by the model since 1969. The performance gap from Max Verstappen to the bunch in 2nd to 5th is approximately as big as the performance gap from them to Piastri (in 12th). Since Norris is part of that pack, it allows for an easy comparison. According to the model, Verstappen vs. Leclerc/Hamilton/Norris/Alonso in the same car would have looked like Norris vs. Piastri on a higher level (if everyone still drove the exact same season under those circumstances). Obviously, it is absolutely possible, that Verstappen wouldn’t have been able to drive a flawless season with harsher competition, but who knows.
As I have mentioned before, this is most likely Maximum Verstappen. For fun I wanted to take a look at how good Less-Than-Max Verstappen was each year of his F1 carreer according to the model. To do this I compared him to other drivers of the 2023 season where possible and to the prime of F1 legends where not. For this only the expected pace is taken into account.
- 2015 – Pierre Gasly
- 2016 – Carlos Sainz
- 2017 – Fernando Alonso
- 2018 – Lando Norris
- 2019 – Prime Niki Lauda
- 2020 – Prime Fernando Alonso
- 2021 – Prime Jackie Stewart
- 2022 – Charles Leclerc
A Quick look At The Teams

- Red Bull
- Aston Martin
- McLaren
- Ferrari
- Mercedes
- Alpine
- Alpha Tauri
- Alfa Romeo
- Williams
- Haas
The RB19 dominated the season on an all time level. The model (“only”) rates it the 7th greatest car of modern Formula 1, narrowly behind the 1996 Williams FW18 and just in front of the W11 and 2002’s Ferrari. While not quite the greatest, the RB19 is rated the most dominant car of modern Formula 1 with some margin. This value is calculated relative to the seasons second best. The Red Bull profits from a very entertaining chasing pack without a clear runner-up. To illustrate this further, if McLaren’s pre-Austria results were voided, Red Bull would drop to second behind the 1992 Williams on that metric.
Compared to August, Aston Martin and McLaren continued their opposing trends, although it wasn’t quite enough for a complete swap. Part of the reason for that is Aston’s relative monopoly on second early in the season, whereas McLaren had stiff competition from Ferrari and Mercedes during their strongest run. Overall the season paints a picture of two distinct groups, as well as 2 lonely constructors (one more than the other). While Red Bull stood alone at the top, Alpine managed to do the same right in the middle.
The season to season comparison with 2022 shows just how big of a step Red Bull and Aston Martin took over the winter. It also shows the 3 Ferrari affiliated constructors going down in parallel. To be fair, so did Mercedes.
With Russell not entirely doing all in his powers, the model rates the Mercedes Duo the 2nd best driver pairing of the season at 81.6, just behind Ferrari (82.5).
On the opposite side of the spectrum the duo of Bottas and Zhou are rated the worst driver pairing for the season with a score of 61.2, just behind Haas (63.0). However, Tsunoda and De Vries were rated lower over their time together at 50.0.
If you want to support this project, please consider leaving a tip
Make a one-time donation
Make a monthly donation
Make a yearly donation
Choose an amount:
Or pick a different amount:
Your contribution is appreciated.
Your contribution is appreciated.
Your contribution is appreciated.

Leave a comment