
While the 2024 Formula 1 season started like 2023 ended, it quickly developed into one of the most competitive seasons in recent memory on a race to race basis. 14 rounds in, we just passed the halfway mark, after what was not too long ago almost a full season of Grand Prix. Here is a quick summer break update on my model’s 2024 ratings. The mathematical model seeks to eliminate the factor car by only measuring drivers against their teammates.
How Does It Work?
My model was inspired by the amazing f1metrics model and therefore shares a significant portion of its methodology.
Step 1 was to introduce a unified points system. P1 gets 10p, P2 gets 10p*0.72=7.2p, P3 gets 7.2p*0.72=5.18p …. etc. all the way to P20. Driver related DNFs are scored with 0p.
Then the 2 teammates get their points assigned for every race. Races where one driver has mechanical issues are excluded (or corrected if possible). Driver errors and other incidents are also excluded (or corrected if possible). Now the points are tallied up and converted on an s-curve. The difference between the two values of the drivers is the performance difference between them.
In combination with functions for age and experience (I use those of the f1metrics model), doing this with all drivers over a lot of seasons, results in a pretty sturdy web of relative driver performances. While building this web, I am not looking for a compromise of all seasons but instead a most perfect fit.
Season Ratings
Now that I have performance ratings (later referred to as ceiling/pace/potential) for the drivers, I can get a value for the car/team in a season since
(points)=(driver performance)+(car performance)
and therefore
(car performance)=(points)-(driver performance)
The driver errors are then added back in, giving a new points total, and through
(points)-(car performance)=(driver performance)
I get the actual performance of the drivers in that season. Those performance ratings are then translated back over the s-curve to give a “points per race rating” which goes from 0-10. That is then multiplied by 10 to get a neat driver score of 0-100.
As you can see, the major difference to the f1metrics model is the handling of driver errors. In my opinion this results in more accurate ratings as the amount of errors a driver makes can vary widely from season to season. Secondly, it has the advantage of untieing teammates in a season. A drivers rating won’t automatically get boosted just because his teammate is having a shocker.
At its core the model is assessing a drivers ability to score points with
(total points)=(possible points)-(lost points)
This can be abstracted onto the drivers. Simplified the drivers’ season ratings can then be understood as
(driver rating)=(driver pace)-(driver mistakes)
To help give some perspective for the ratings I made these tiers:
- S – above 89
- A – above 82
- B – above 73
- C – above 62
- D – above 50
- F – below 50
From going through all the data and seasons, I would say that generally a good season has a score above 73. Keep in mind, though, that there are no real cut lines. Another bit of context is that for the last 20 years the median performance slowly crept from around 60 towards 70. In 2021 it then jumped above 70 and has since stayed in the low/mid 70s.
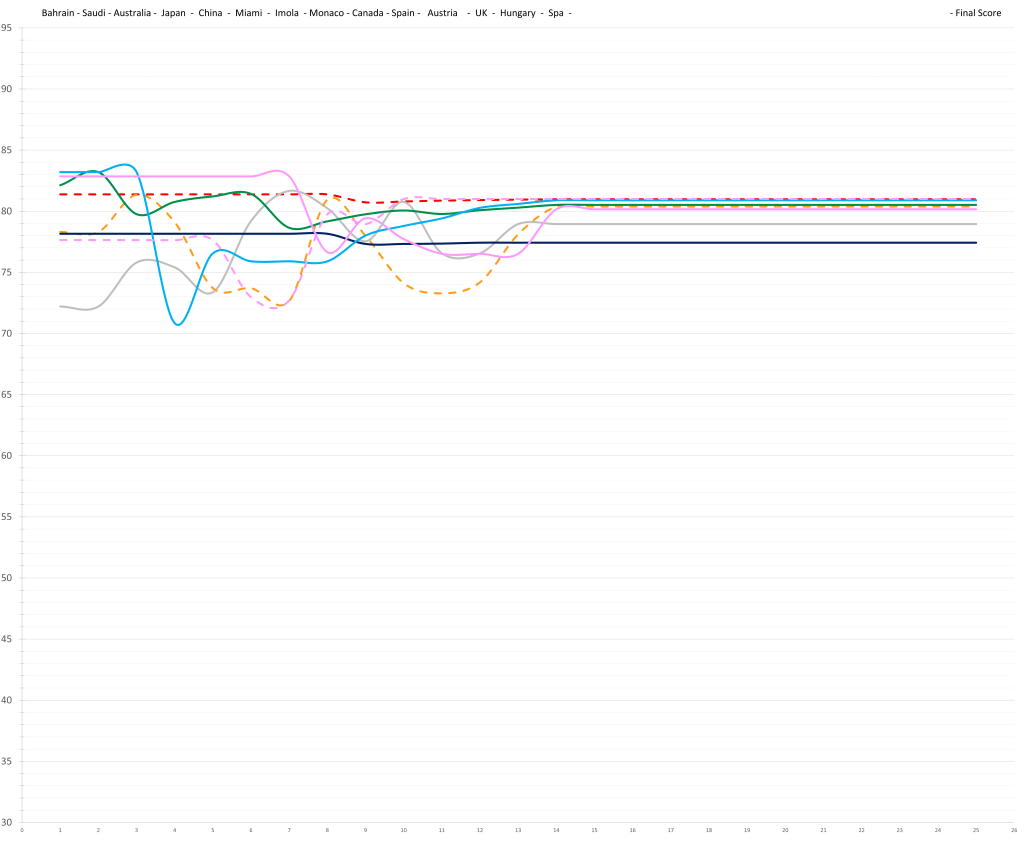
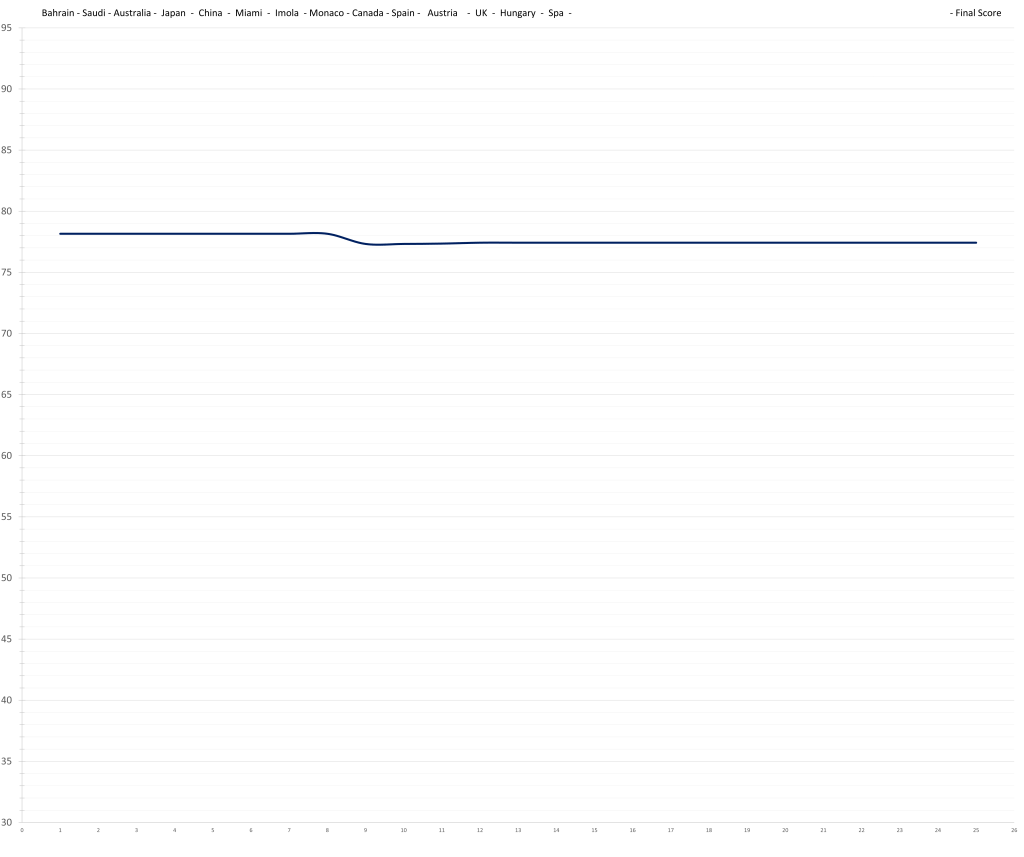
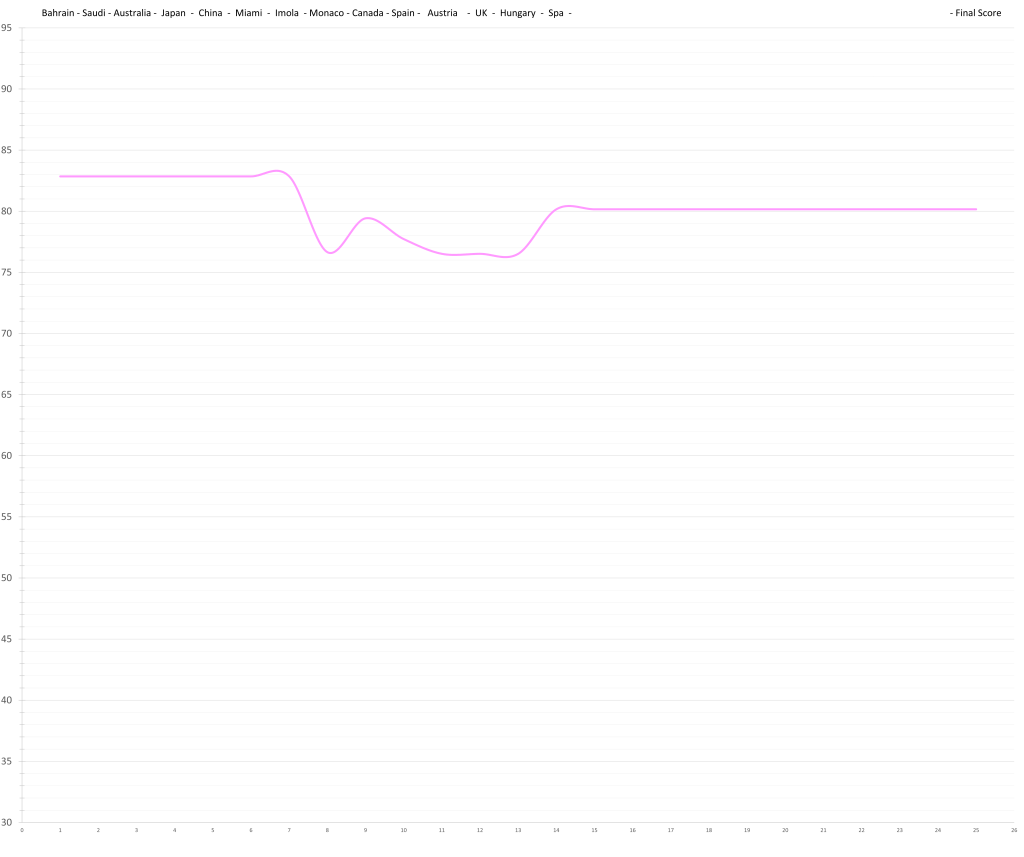
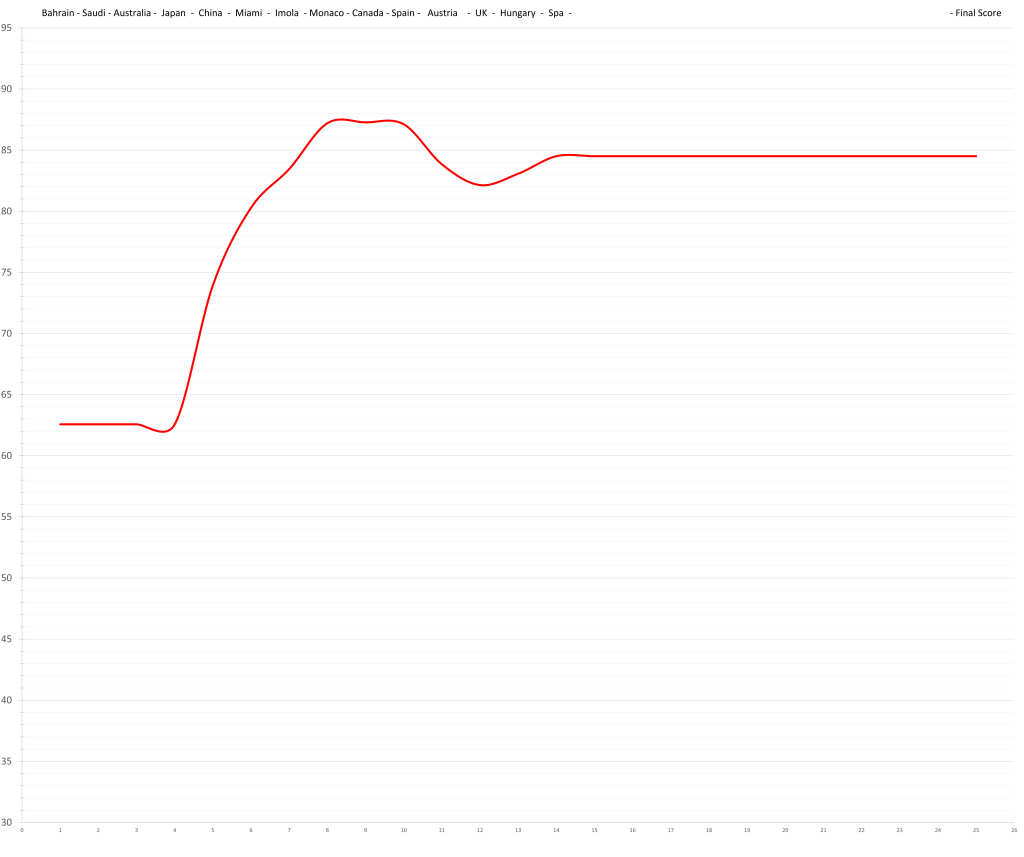
Each driver has their own entry including a graph documenting the change of their season rating through the races, a short summary and of course the actual rating. Behind the rating (in parentheses) you’ll find the drivers expected baseline rating for the 2024 season. It roughly equates to pace and can be understood as a ceiling (only for this season since this value moves with age and experience). It gives you a better understanding and context for the actual driver rating in terms of underperformance, mistakes, consistency, speed etc.
The “Should-Be-Gones and Could-Go-Ons”
20 – Kevin Magnussen – 46.9 (66.3)

Kevin Magnussen is flailing. The delta to teammate Hulkenberg is far worse than it should be which could mean one of two things: Either Hulkenberg is pulling a career best performance out of nowhere, or (the default) Kevin – who is chronicly inconsistent – is having a really bad season.
19 – Sergio Perez – 50.1 (72.6)
It stopped being funny some time ago.
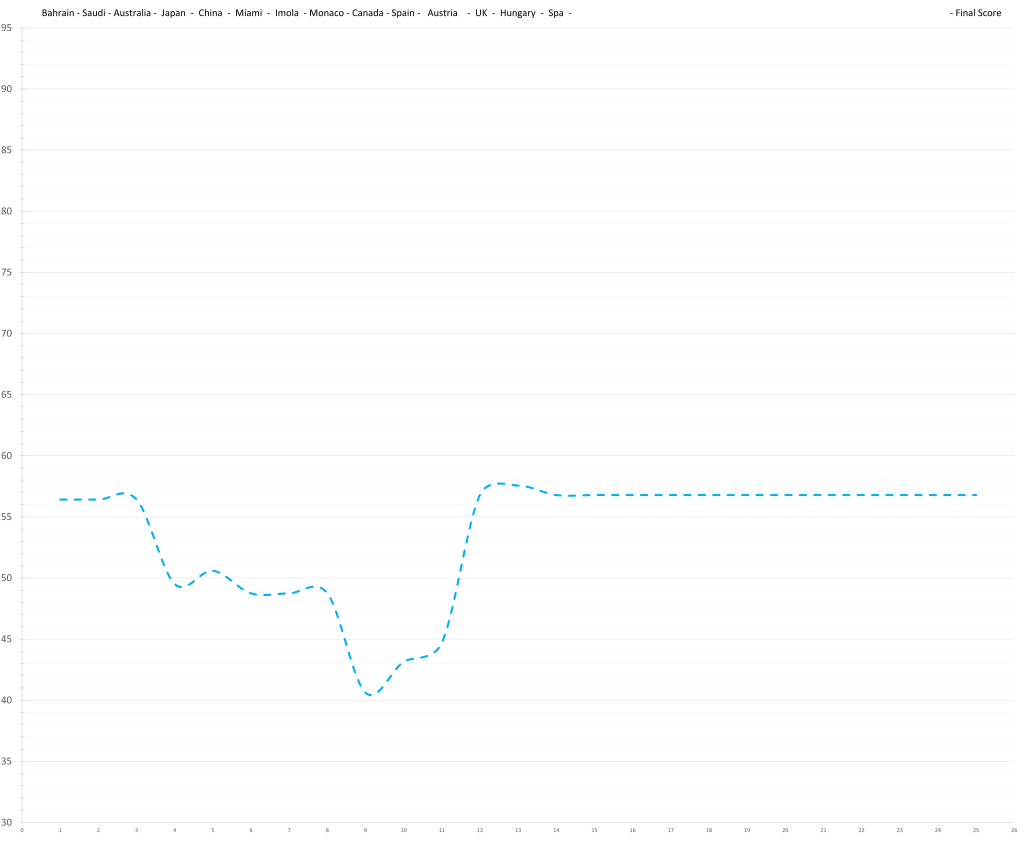
18 – Logan Sargeant – 56.8 (67.9)

Logan Sargeant has had barely any clean races so far. Luckily (for his score), Silverstone was one of the few. With Williams being uncharacteristicly competitive (although it’s not a complete anomaly), his P11 pulls quite a lot of weight. This is also clearly visible in the graph, where it shows up as a big jump for Logan, essentially lifting him out of “Should-Be-Gone” territory.
17 – Zhou Guanyu – 57.5 (66.3)
Zhou has an insane quali deficit to Bottas this year, but that doesn’t quite show up in the race results. Partly, because Bottas leans towards qualifying, and partly because the Sauber is abysmal. It will take a far longer time for the trend to materialise itself properly in the ratings. On top of that, this is hindered by Sauber being operationally ill equiped to the point where almost half of all races can’t be considered a fair comparison.

The “Mid-Pack”
16 – Valtteri Bottas – 63.7 (71.6)

Valtteri Bottas is dominating his teammate and most of the time, he gets everything he can out of the car. That is very similar to Hulkenberg, yet he doesn’t get close to the same recognition because the car team is awful.
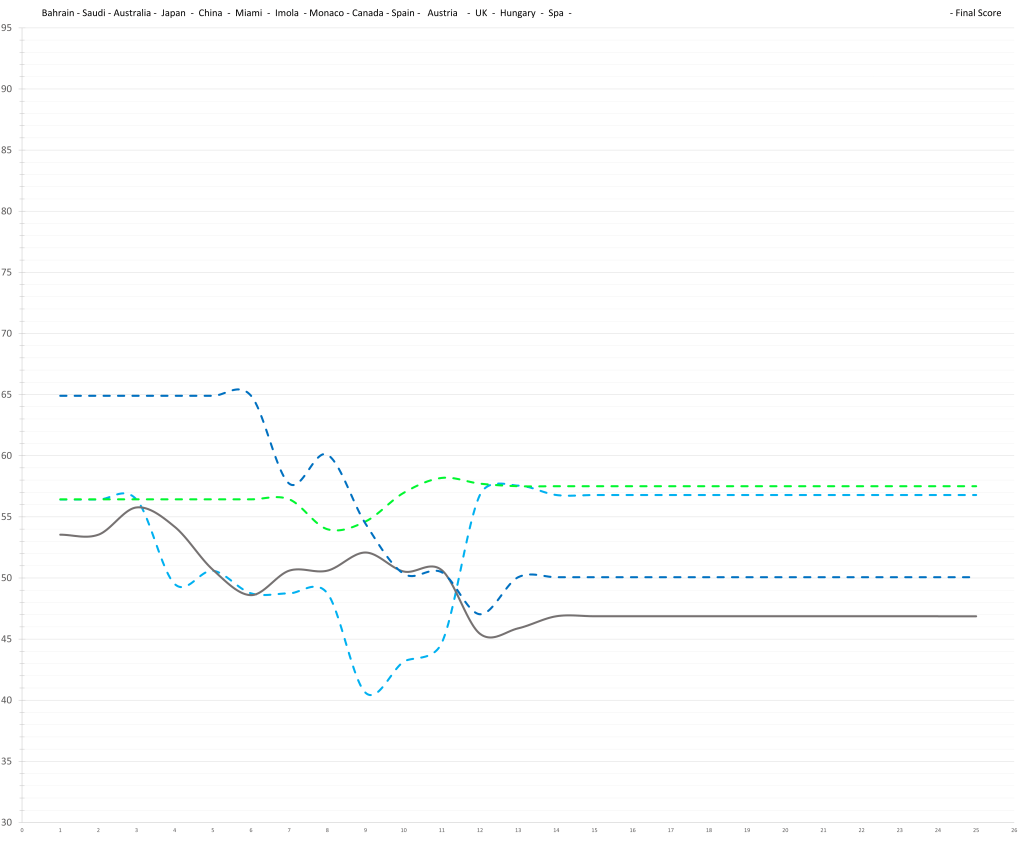
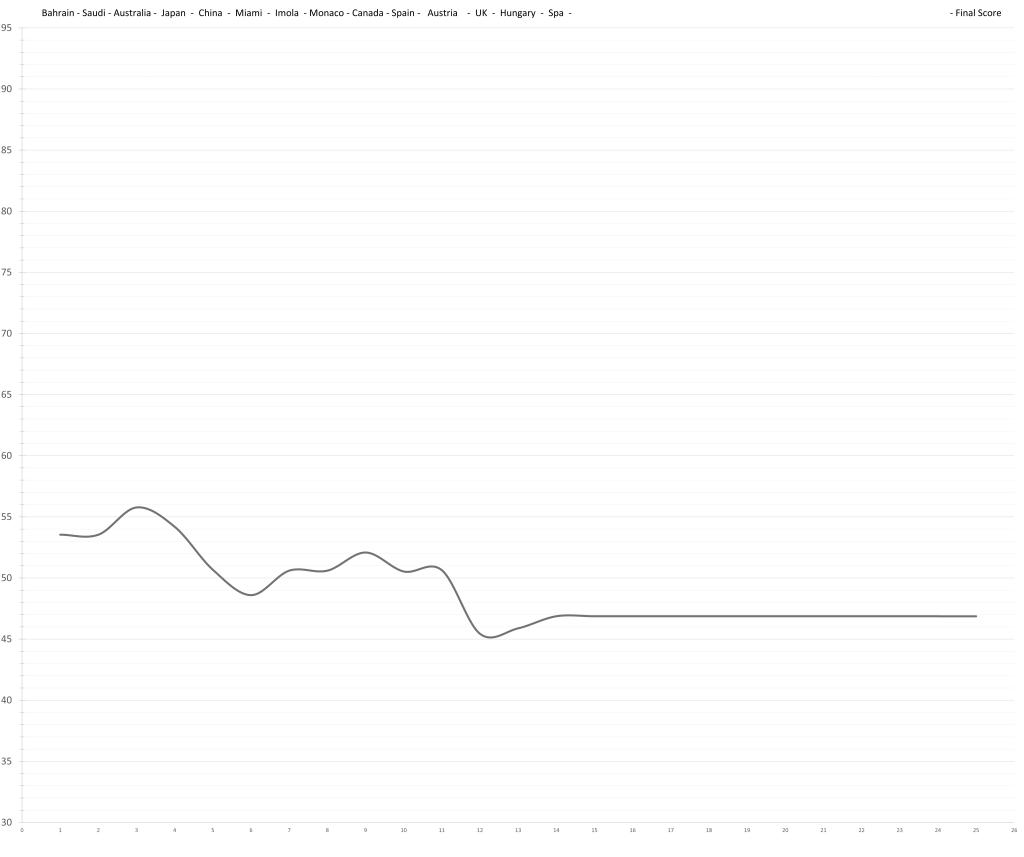
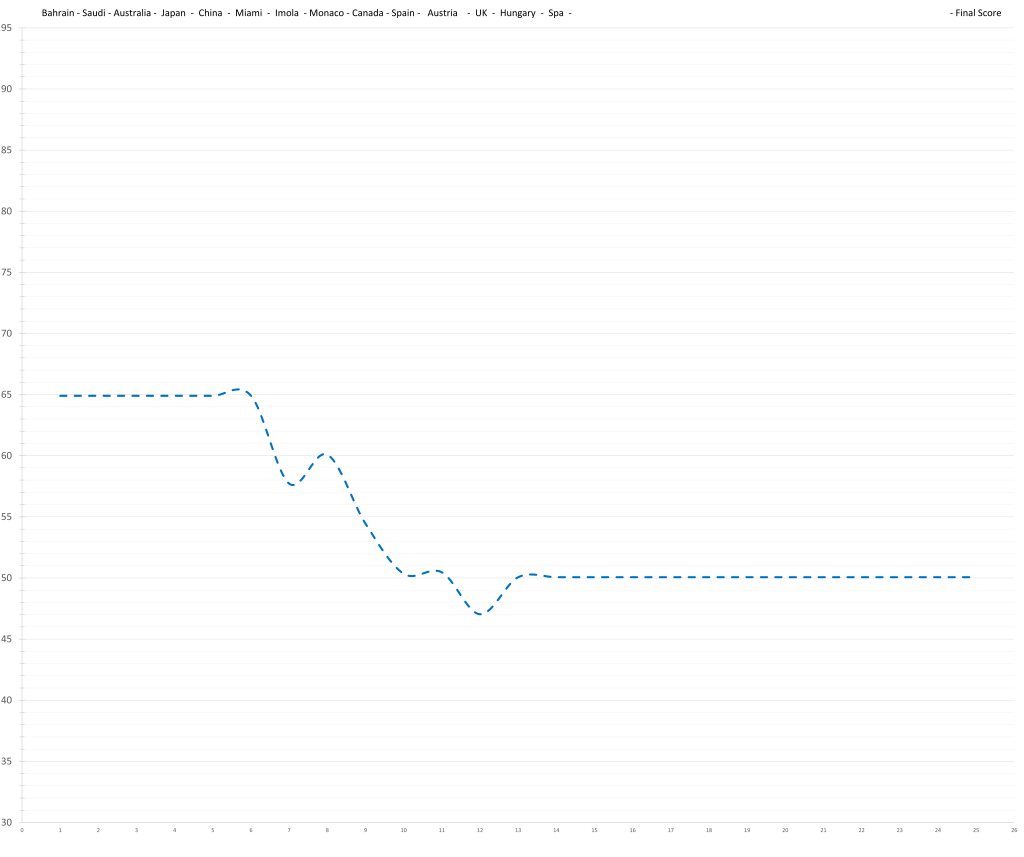
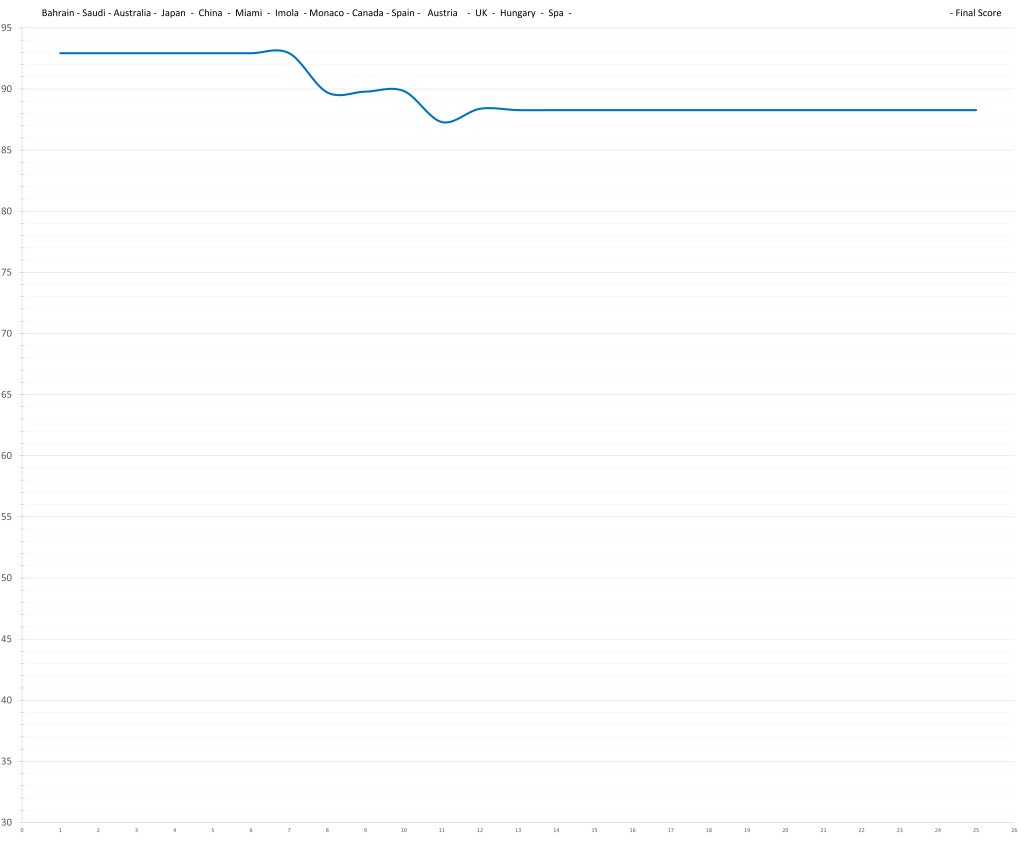
15 – Daniel Ricciardo – 65.2 (79.4)
/cdn.vox-cdn.com/uploads/chorus_image/image/73167362/2032936126.0.jpg)
Although the team officially couldn’t find any faults in Daniel Ricciardo’s old chassis, since the change the delta fits expectations while Ricciardo was massively underperforming before the change. It might just be a timing coincidence or psychological, though. At this point, Ricciardo is even a bit underrated, getting unlucky in recent races. The model predicts Daniel and Yuki to be one of the closest pairings on the grid on pace.
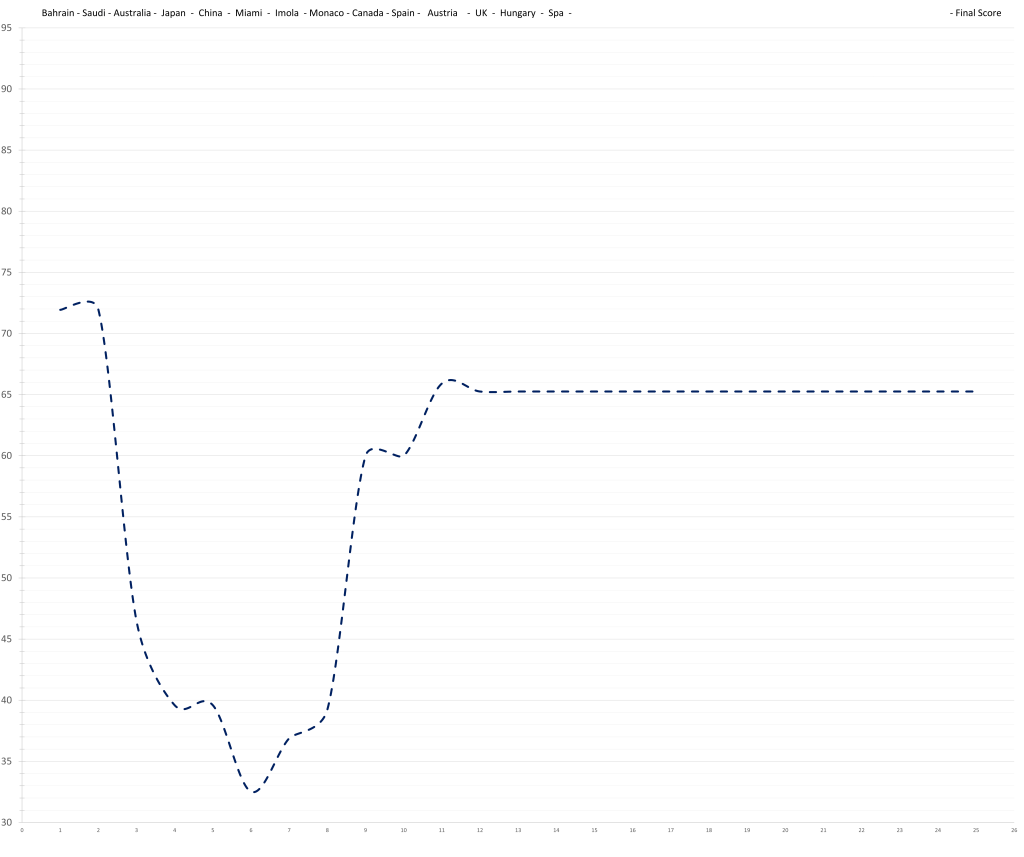
14 – Lance Stroll – 67.1 (76.4)
Lance Stroll is not a great driver, but sometimes Lance Stroll is a pretty good driver. Most of the time, he is not. Most of the time that has little to do with pace at all. Sometimes he has a few races in a row, where he puts it together and looks decent. That’s when people say: “Alonso is taking it easy”.
13 – Nico Hulkenberg – 67.3 (69.5)

Nico Hulkenberg is dominating Magnussen far beyond expectations. While it is tempting to fully ascribe this to Hulkenberg, realisticly Magnussen just has a really bad year and the Haas is leading the midfield by now.
The “Good Ones”
12 – Yuki Tsunoda – 77.4 (78.2)

Yuki Tsunoda has made some big steps over the last two seasons. There is the assumed increase in pace through age and experience, but there is also a different maturity. 2023 and 2024 (so far) have seen Tsunoda become a lot more reliable and consistent. The data on Yuki is still relatively slim, however the model would expect him to be very close to Ricciardo this year. He started the season dominating the Australian but since Daniel had the chassis change, the delta seems to comply with expectations.
11 – Lewis Hamilton – 79.0 (85.8)

Lewis Hamilton is running behind expectations so far. The delta to Russell is not huge but according to the model the two Mercedes drivers should be each others equal this season. That is not what’s happening, though. I expect him higher up by the end of the season, especially since the Mercedes has recently become a front runner again. This should help in outweighing Austria, as well as diminishing the effect of his poorest phase earlier in the season.
At this point, it is very close from 11th to 4th. A single race weekend can make the difference in this tier of drivers. It once again shows the insane quality of the current F1 grid. To have the bulk of drivers at this level is completely unique compared to previous eras.

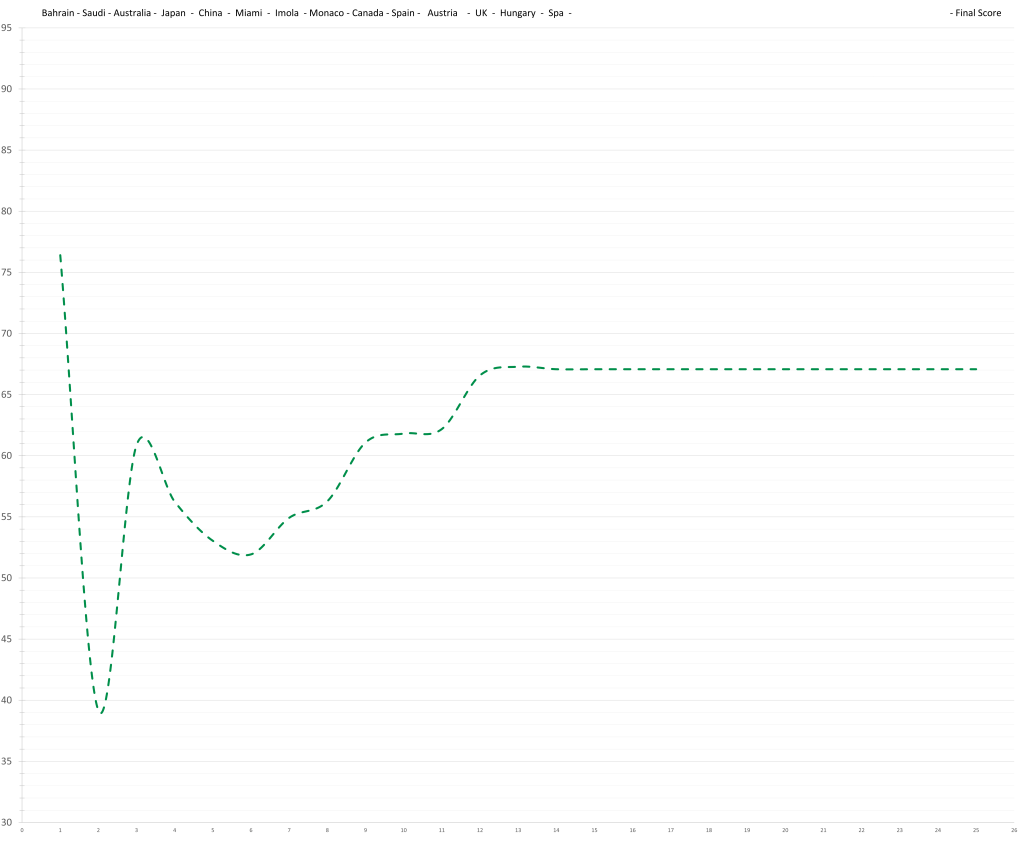
10 – Esteban Ocon – 80.2 (82.8)

Once again the Alpine drivers are very close on pace. Esteban Ocon is a bit unlucky so far since most of his head-to-head wins came when the car was less competitive. What’s really putting him below Gasly, though, is his unexplainably dumb maneuver at the Monaco Grand Prix. A lot of accusations from both sides of the garage have been thrown around explaining why they were at a disadvantage compared to their teammate. It’s hard to verify any of it and for now it should probably be regarded as (to put it nicely) psychological warfare.
9 – Oscar Piastri – 80.4 (83.5)
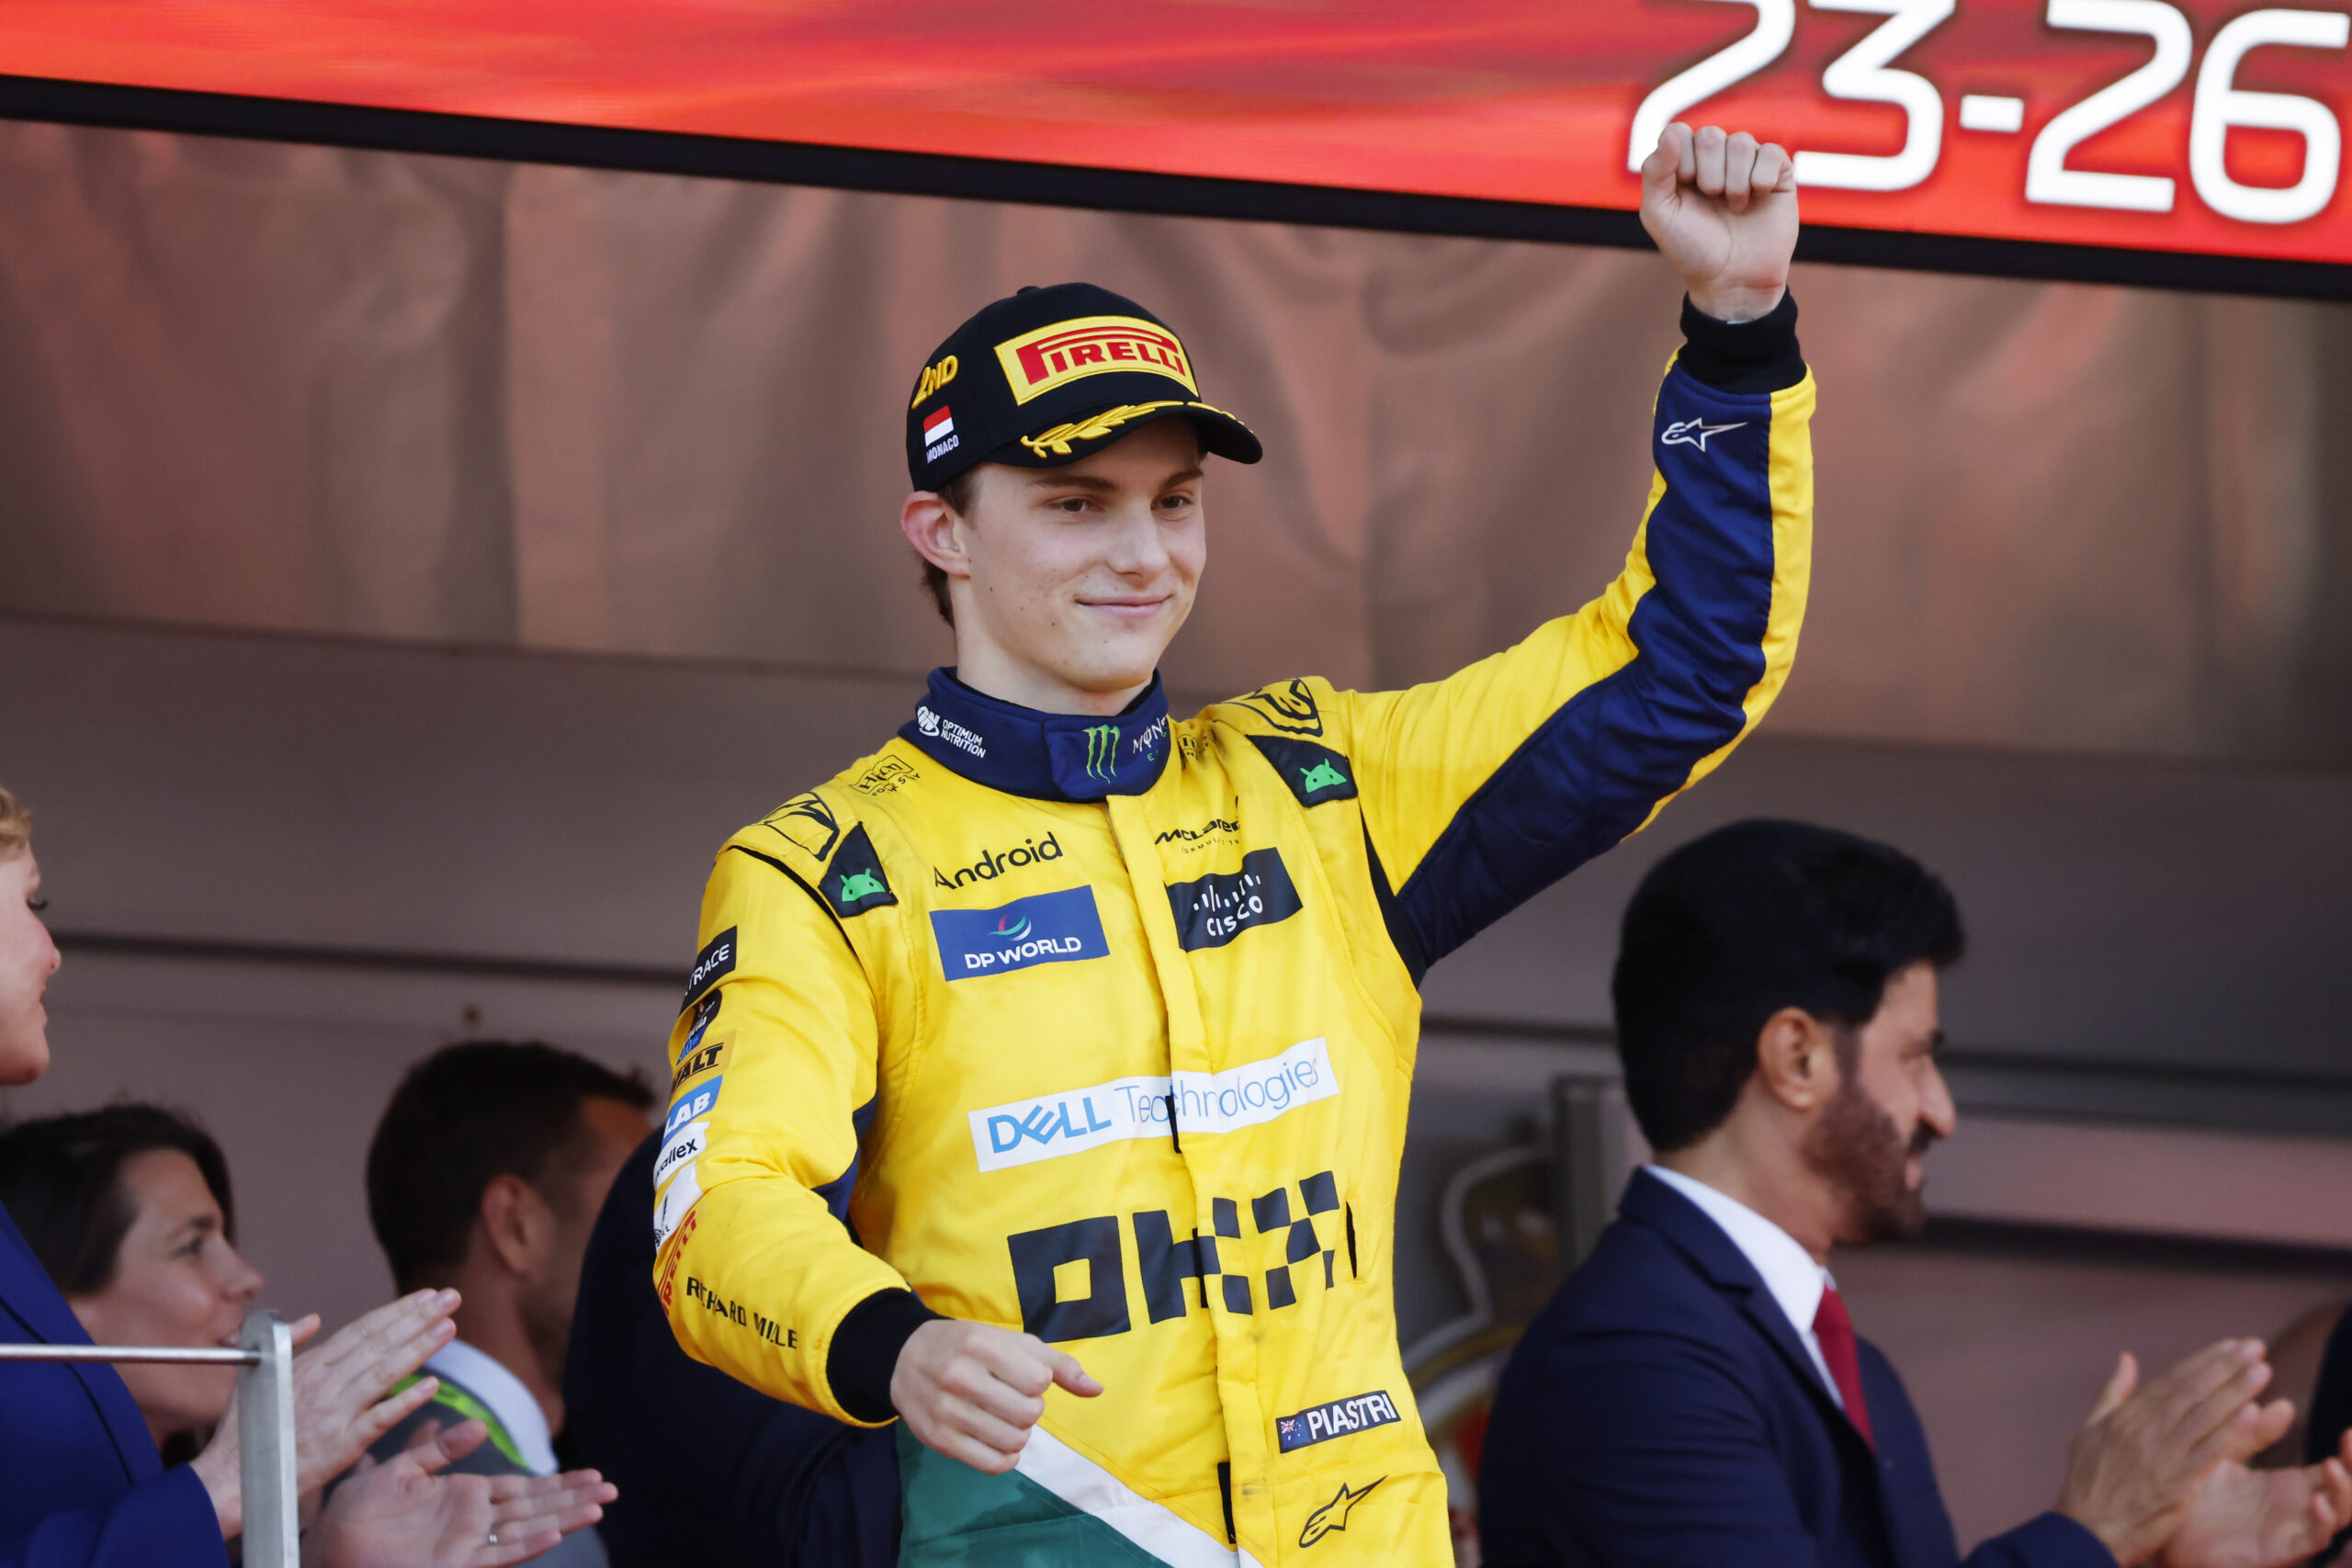
Without Hungary, Oscar Piastri’s delta to Lando Norris is very big. It would almost suggest no development since his rookie season. It could be argued, that he was hampered by luck which got paid back in Budapest. If that’s the case, he only needs more races for that to show up. Fortunately, he still has plenty in modern Formula 1.
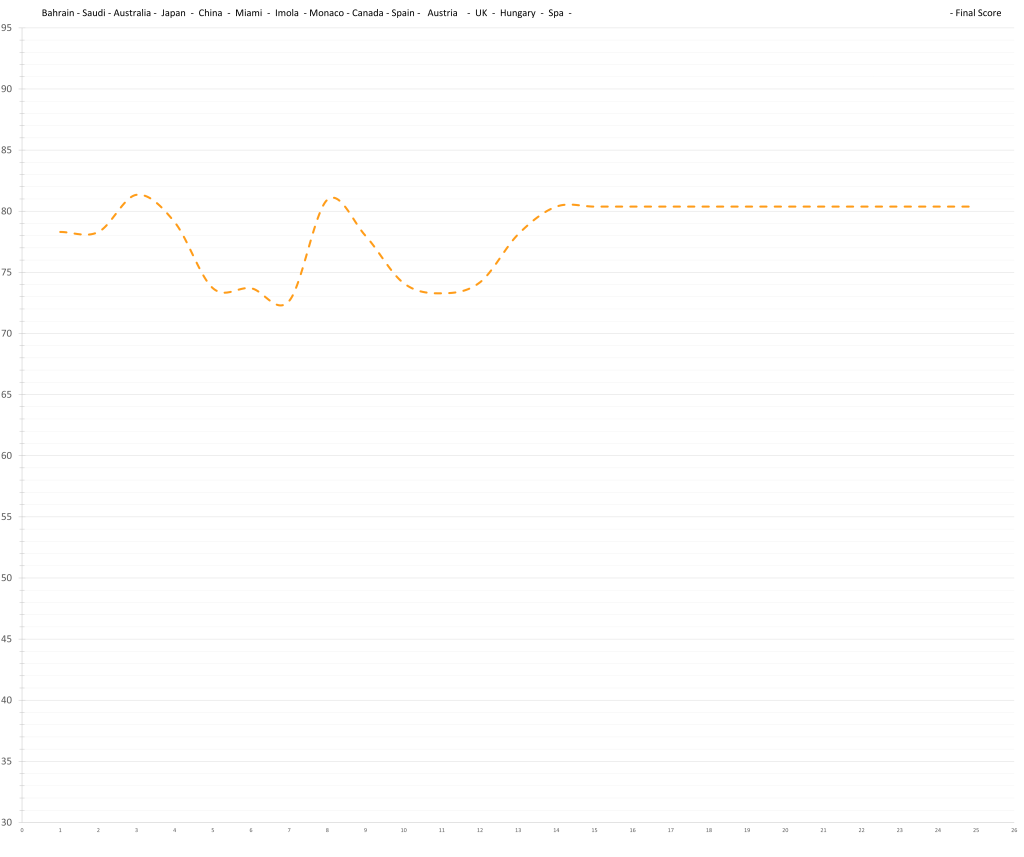
8 – Fernando Alonso – 80.5 (83.2)
Age is not even stopping for Fernando Alonso. He is still a very capable driver but it won’t be too long, before Alonso will drift into mediocrity. It’s harder to notice year to year but at some point he will noticiably not be a top driver anymore and a lot of people will pretend it happened over night. Some already say he’s not there anymore, while last year he was one of the best, when most of that perception is down to car performance.

7 – Alexander Albon – 80.9 (83.2)

Alex Albon is still doing well and still based on pretty slim data.
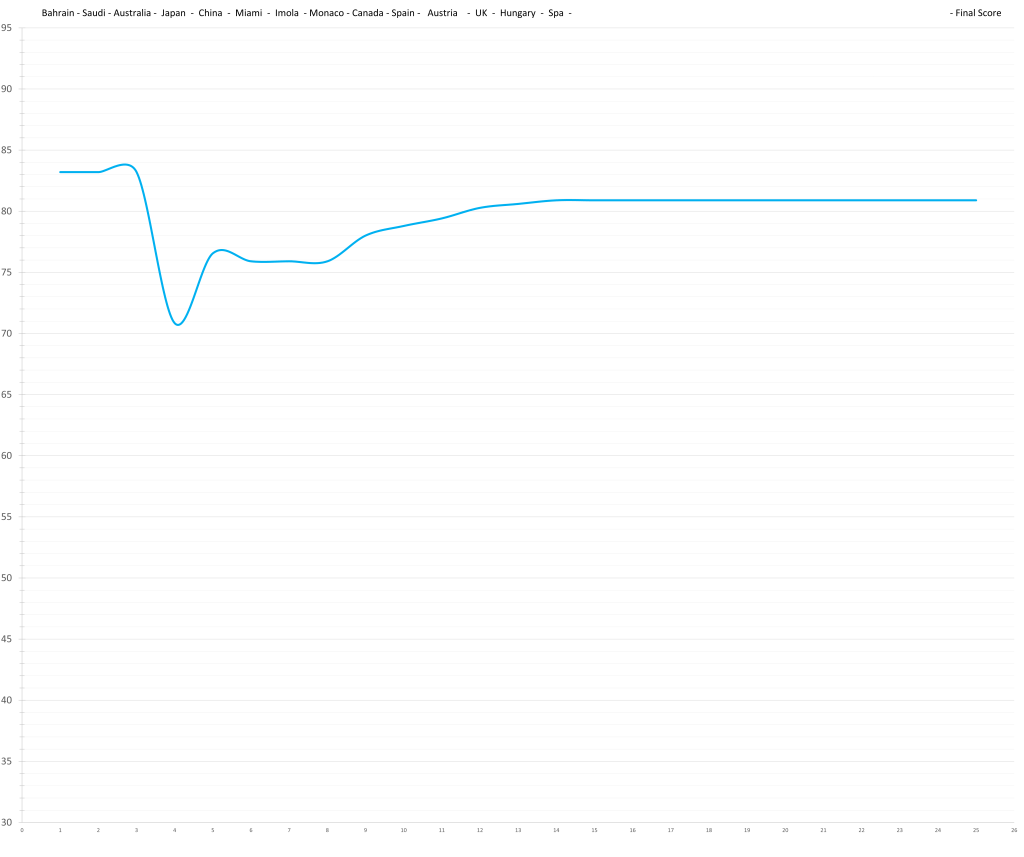
6 – Carlos Sainz – 81.0 (81.4)
Carlos Sainz is back as he is almost certainly on track for his best season since 2021. Ironicly, he won’t be back with Ferrari next year. It’s a nice farewell present to the Scuderia.
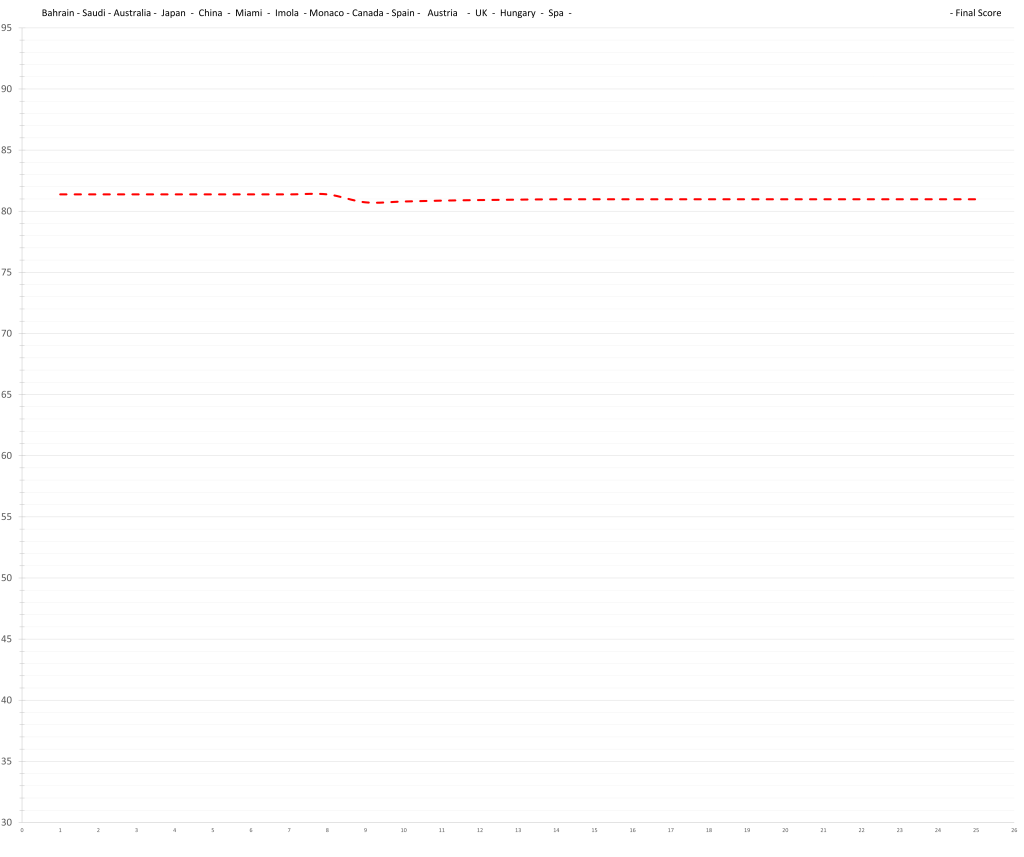
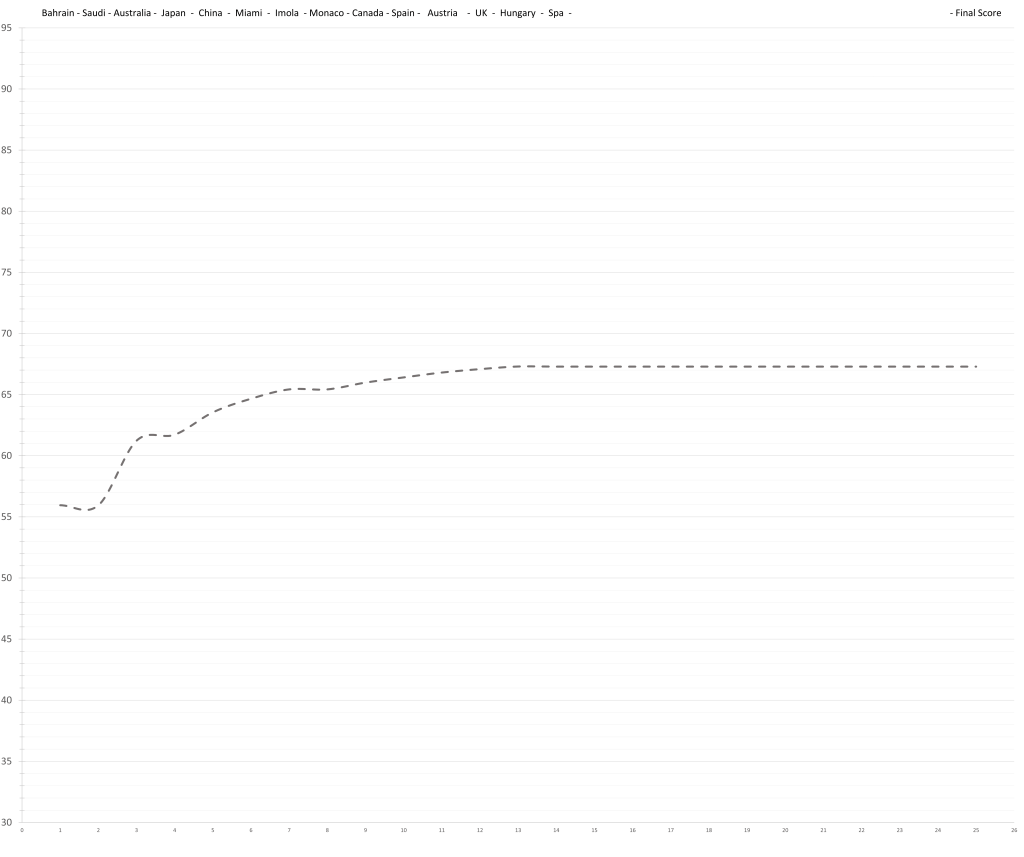
5 – Pierre Gasly – 81.0 (81.0)
Unfortunately, Gasly can’t leave Alpine for next season like Ocon. What a waste. So far he has proven the more consistent of the two french drivers, although it would also be difficult to even notice a bad weekend in that team.

The “Quartet of Quality”
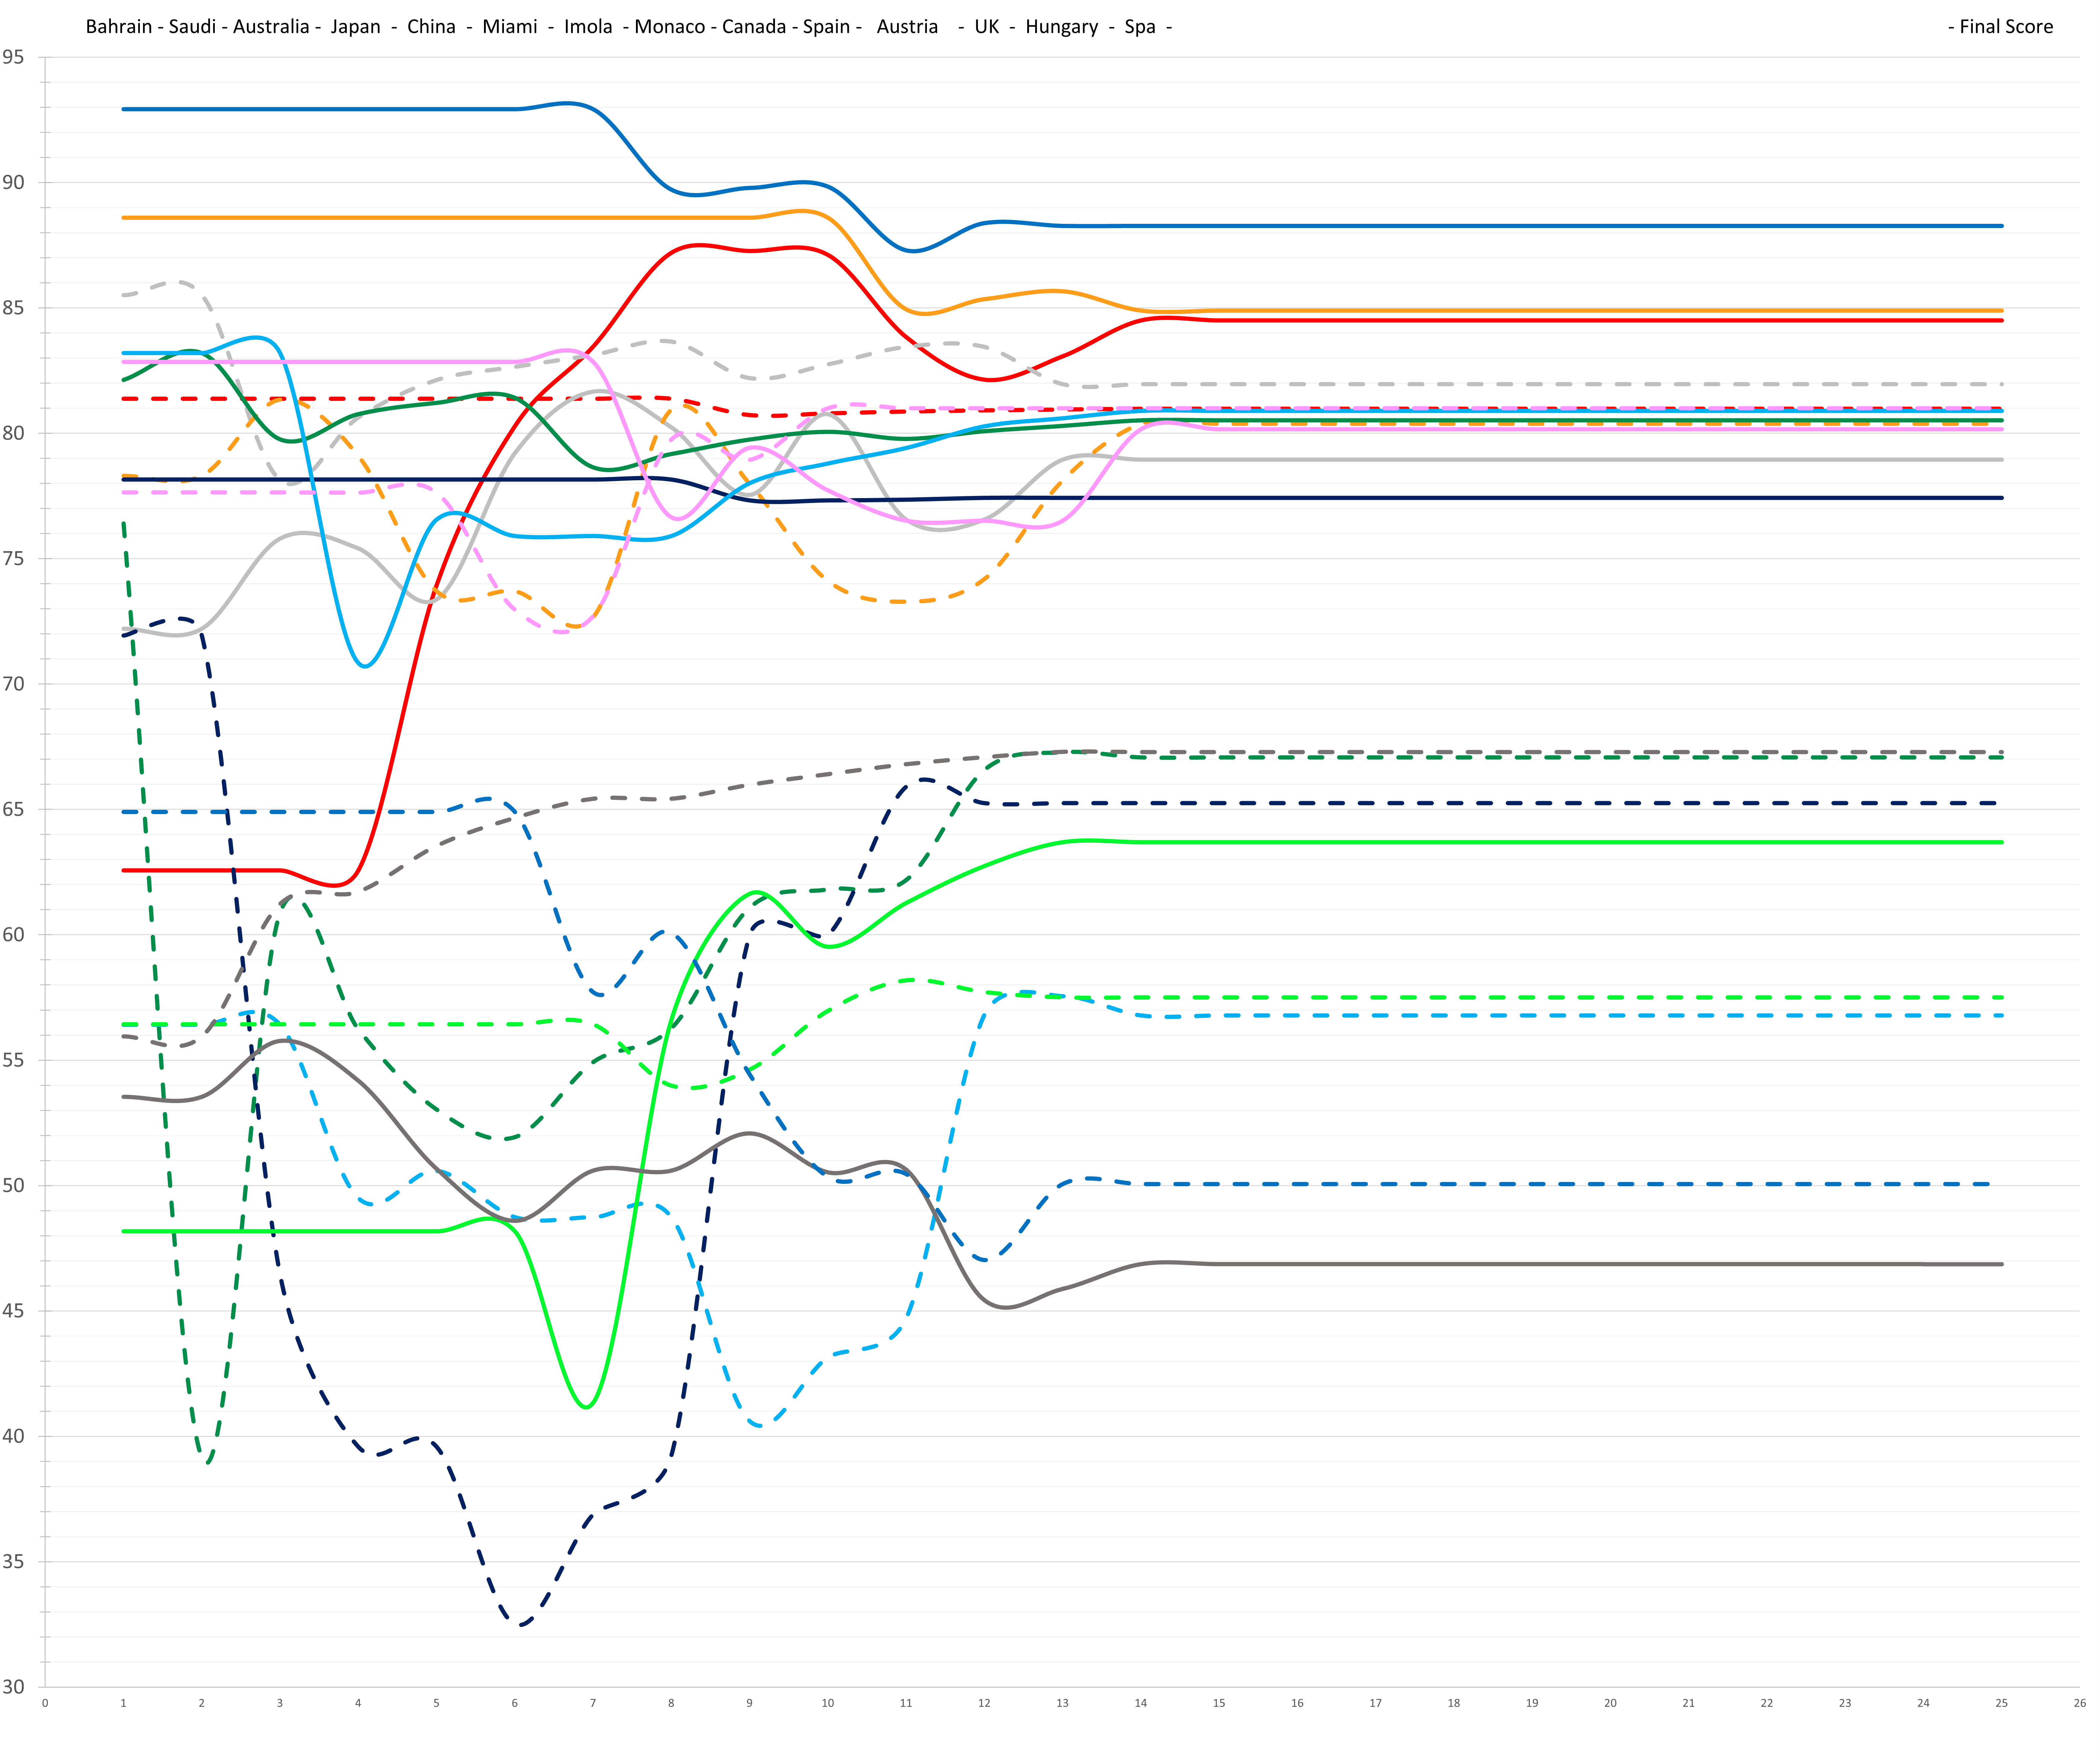
4 – George Russell – 82.0 (85.5)
George Russell is currently having a personal best season. This is obvious with and without a data driven approach. He seems quicker than Hamilton but also to have grown more mature and patient. There have been some moments of overeagerness but his step up from 2023 is still quite noticeable.

3 – Charles Leclerc – 84.5 (92.1)
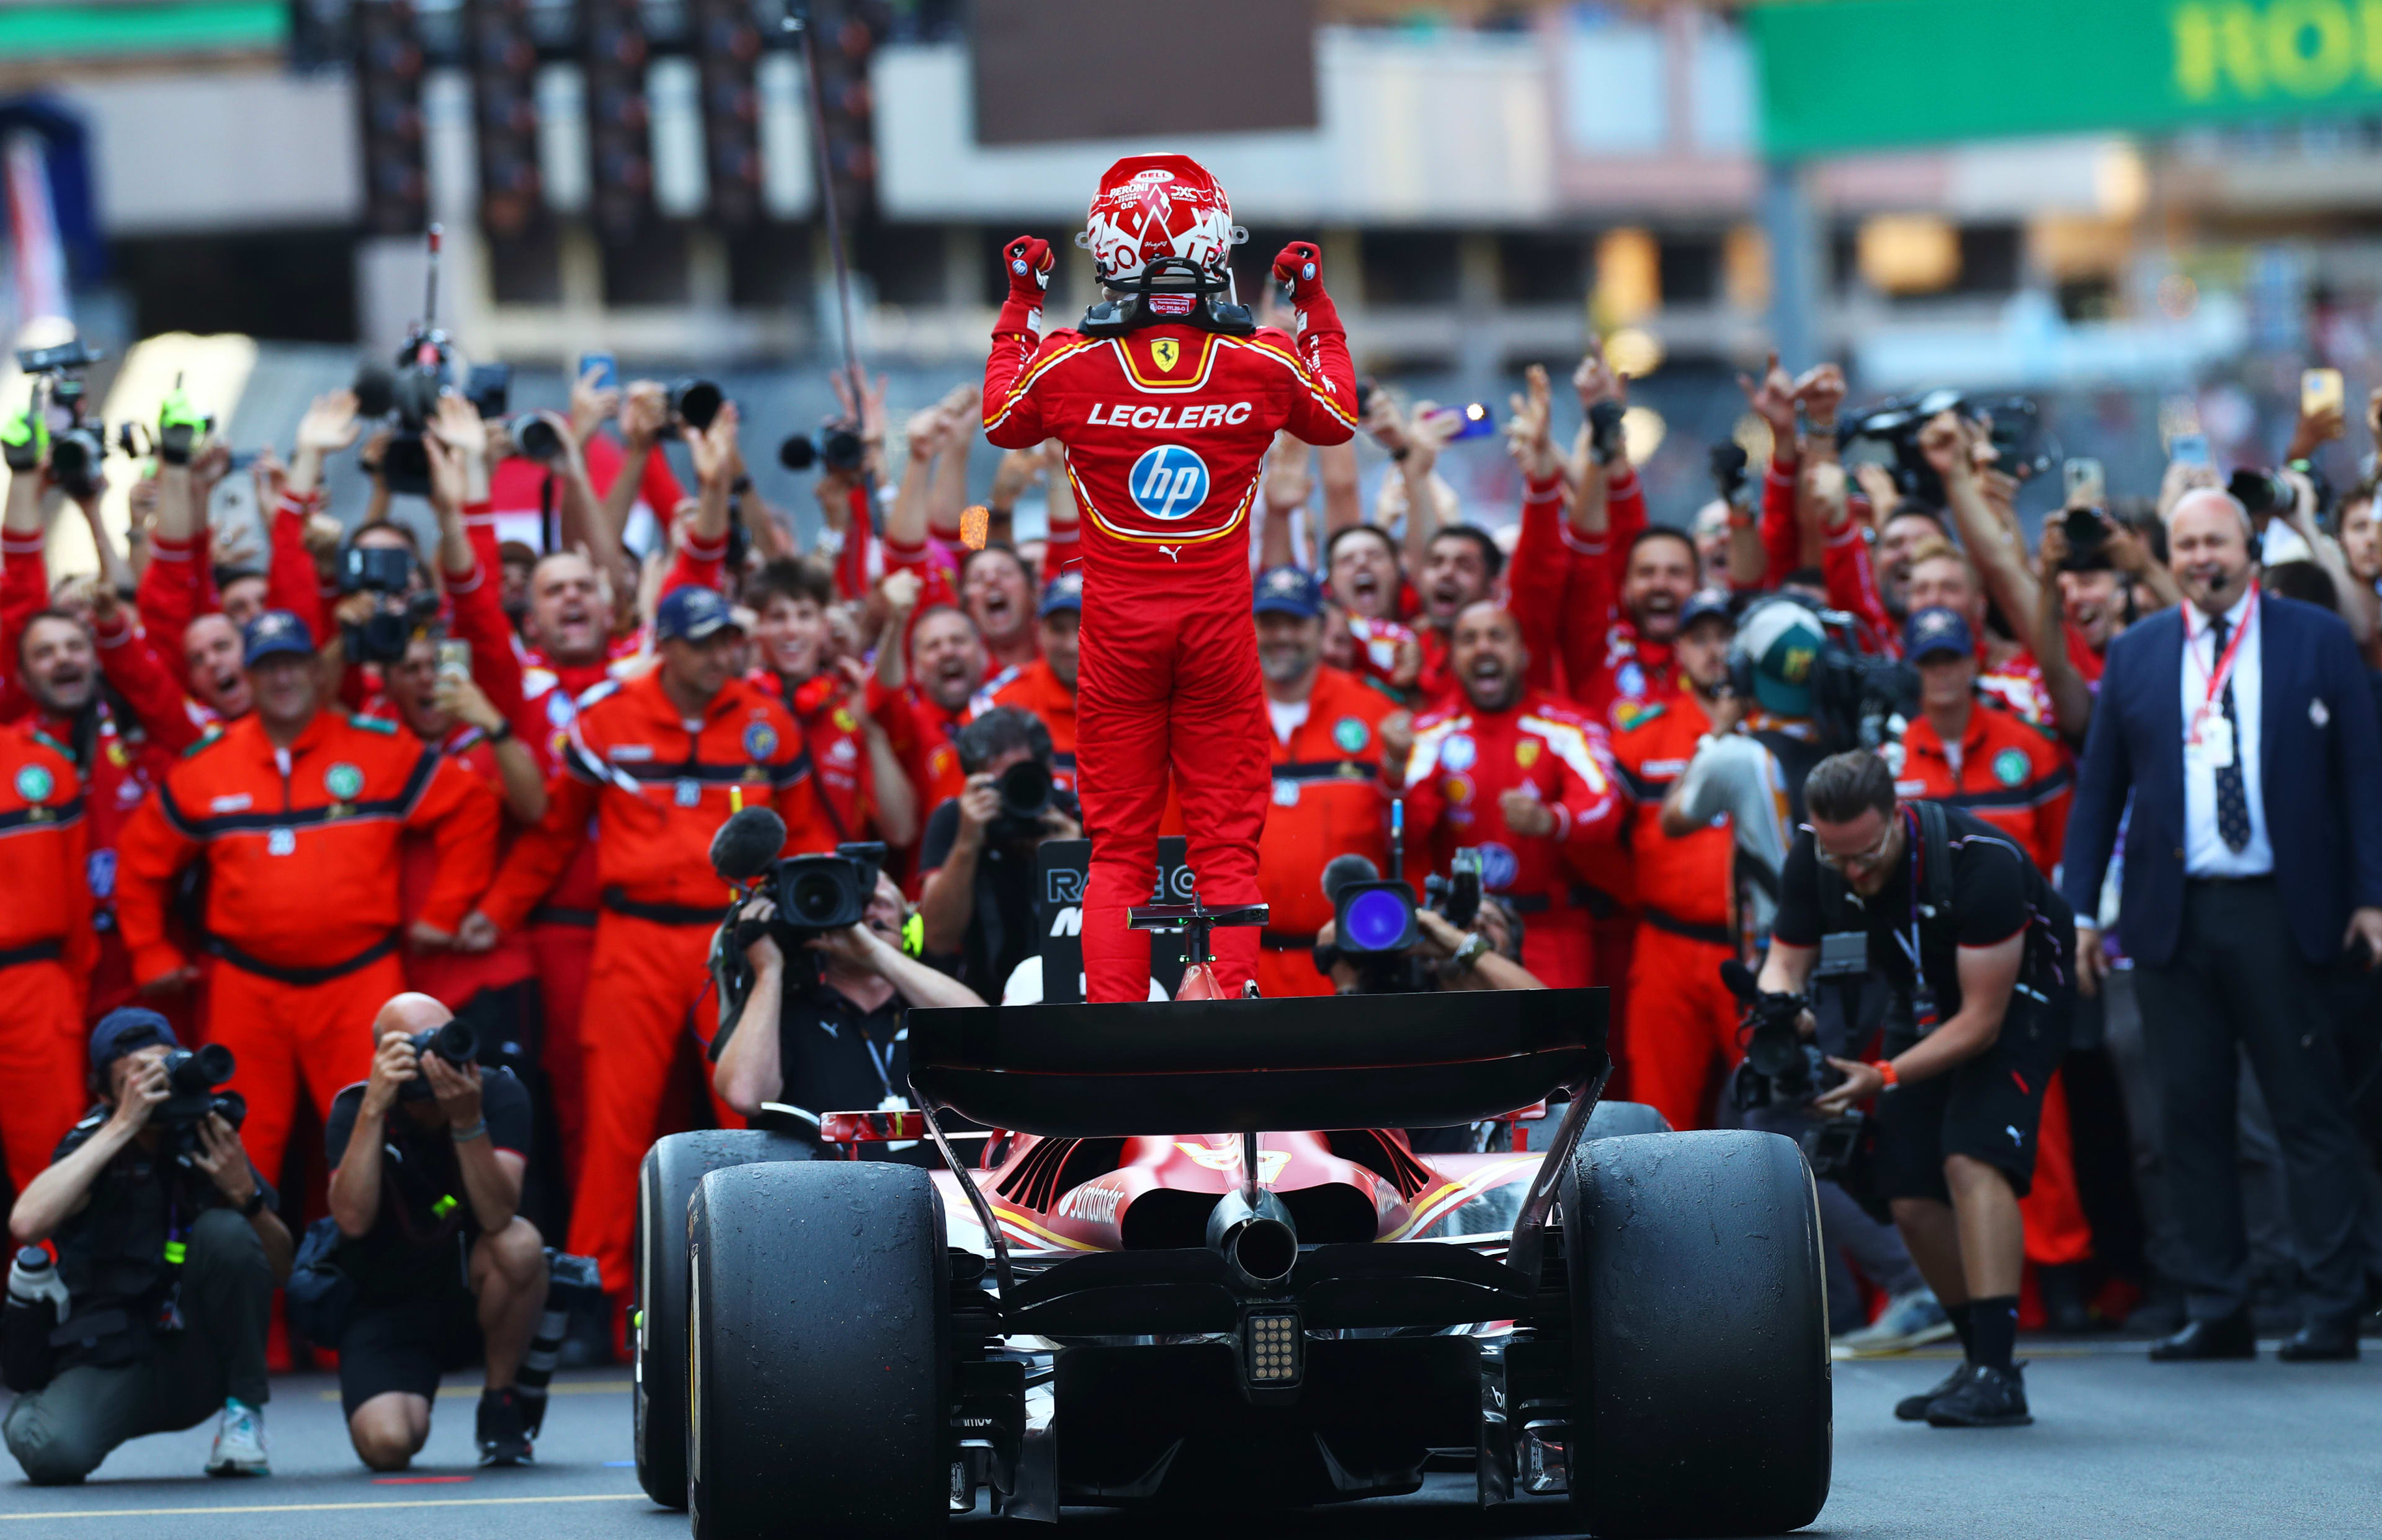
Same old, same old. Charles Leclerc is fantastic but when he isn’t, it’s always horrific. With his first counting race against Sainz being the Australian GP, this started Leclerc on the back foot for this season’s ratings. Once he got rolling, it was only a question of time until the delta (and by extension his rating) normalized. That is exactly what happened until Monaco. Yet, all of that seemed to have drowned in the Monaco harbour for a time.
2 – Lando Norris – 84.9 (88.6)
Lando Norris can’t quite keep up with Max Verstappen. Then again, who can? For most of the season so far, he was exceeding the expected delta against Piastri. His problems lie elsewhere. Somehow, the guy that’s a year younger and has 4 years less of experience seems more mature and collected.

1 – Max Verstappen – 88.3 (92.9)
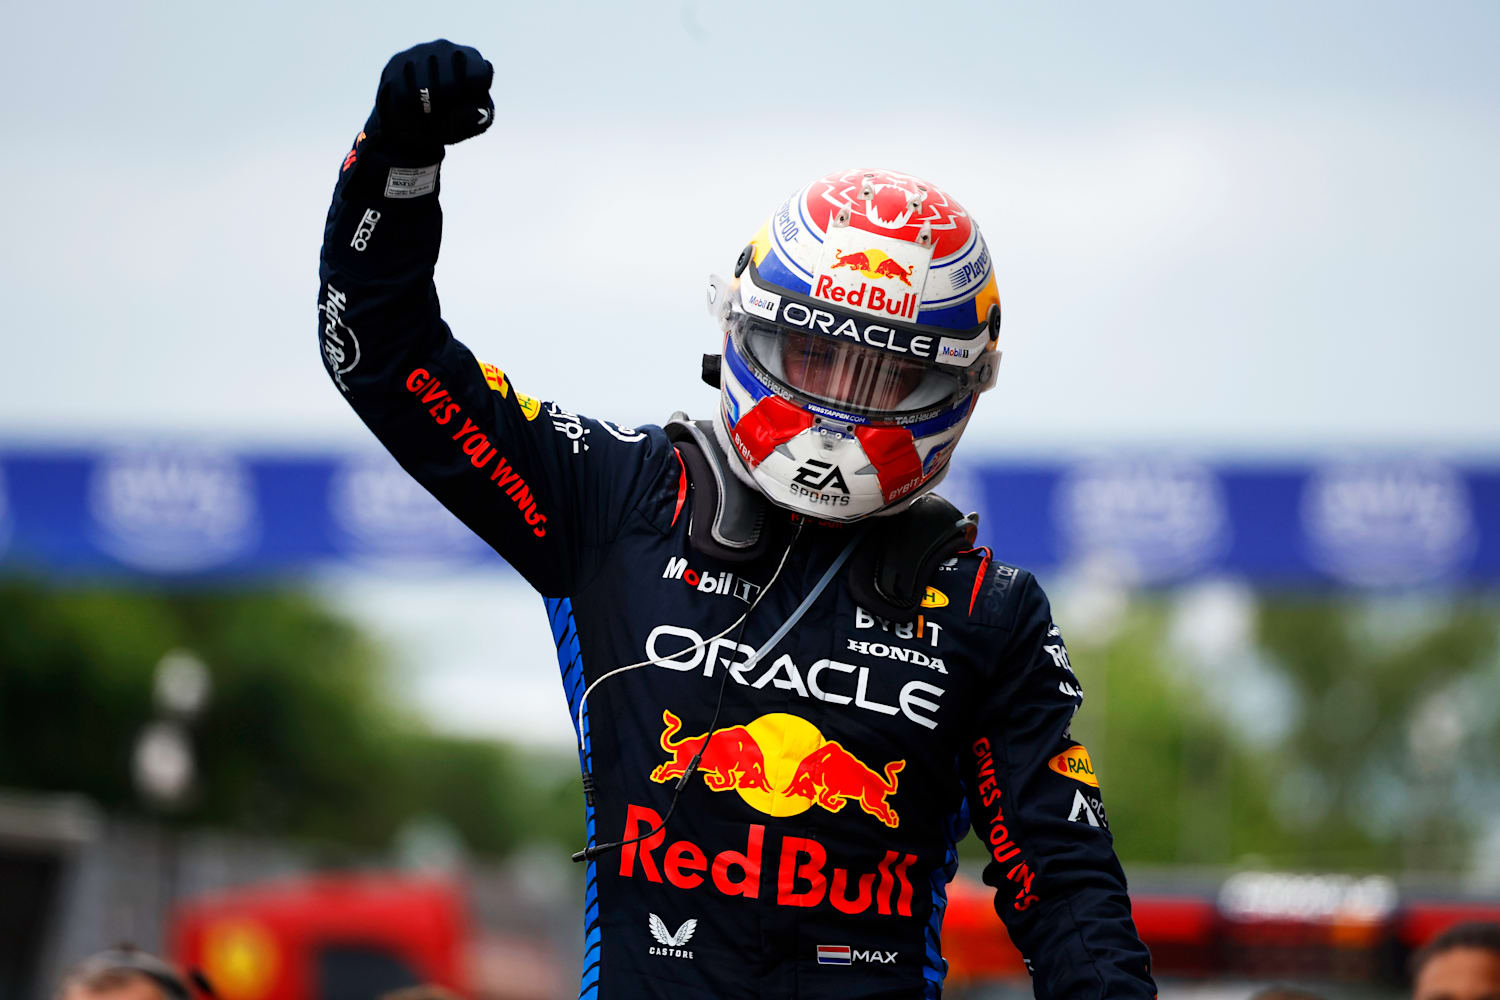
Still Number 1 but Max Verstappen has finally been put under pressure and, as almighty as the rest of his driving has been, he did not cope perfectly at all times. However, even with these mistakes it seems like Verstappen is on his way to take his 6th “title” in a row from the model, equaling Alonso’s streak from 2008 to 2013. On the other hand, not even Max will probably come close to Schumacher’s 11 in a row, 10 of which unchallenged. His competition should be too strong for that.
A Quick look At The Teams
- Red Bull
- McLaren
- Ferrari
- Mercedes
- Haas
- Aston Martin
- Alpha Tauri
- Alpine
- Williams
- Sauber
Red Bull is still far head overall, but that gap has been coming down race by race. Over the 9 rounds since Miami, Red Bull and McLaren are rated equal with the smallest edge to the papaya outfit.
In no news to anyone, Aston Martin, Alpine and Sauber have suffered an incredible loss of performance compared to everyone else. This leaves Haas at the spear end of the midfield so far. Maybe a bit more surprising is that Williams is rated just as low as Sauber. However, according to the model they have the by far best driver in Albon out of the 2 teams. Additionally, Sauber has been consistent, while Williams have their highs and lows which is far more viable with the F1 points system.
On the driver side, there are 2 clear leaders tied at 82.8 in Ferrari and McLaren.
At Haas, Magnussen tanks the rating of the pairing to 57.4, while Sauber still has the 2nd lowest rated driver pairing (60.6).

Leave a comment