
The “Silver Wars” Era
was completely dominated by Mercedes and their all-conquering hybrid engine. The two best drivers couldn’t have been in more opposite situations, contributing to the dullness, and so it was Mercedes vs. Mercedes for the championships. The mathematical model seeks to eliminate the factor car by only measuring drivers against their teammates.
How Does It Work?
My model was inspired by the amazing f1metrics model and therefore shares a significant portion of its methodology.
Step 1 was to introduce a unified points system. P1 gets 10p, P2 gets 10p*0.72=7.2p, P3 gets 7.2p*0.72=5.18p …. etc. all the way to P20. Driver related DNFs are scored with 0p.
Then the 2 teammates get their points assigned for every race. Races where one driver has mechanical issues are excluded (or corrected if possible). Driver errors and other incidents are also excluded (or corrected if possible). Now the points are tallied up and converted on an s-curve. The difference between the two values of the drivers is the performance difference between them.
In combination with functions for age and experience (I use those of the f1metrics model), doing this with all drivers over a lot of seasons, results in a pretty sturdy web of relative driver performances. While building this web, I am not looking for a compromise of all seasons but instead a most perfect fit.
Season Ratings
Now that I have performance ratings (later referred to as ceiling/pace/potential) for the drivers, I can get a value for the car/team in a season since
(points)=(driver performance)+(car performance)
and therefore
(car performance)=(points)-(driver performance)
The driver errors are then added back in, giving a new points total, and through
(points)-(car performance)=(driver performance)
I get the actual performance of the drivers in that season. Those performance ratings are then translated back over the s-curve to give a “points per race rating” which goes from 0-10. That is then multiplied by 10 to get a neat driver score of 0-100.
As you can see, the major difference to the f1metrics model is the handling of driver errors. In my opinion this results in more accurate ratings as the amount of errors a driver makes can vary widely from season to season. Secondly, it has the advantage of untieing teammates in a season. A drivers rating won’t automatically get boosted just because his teammate is having a shocker.
At its core the model is assessing a drivers ability to score points with
(total points)=(possible points)-(lost points)
This can be abstracted onto the drivers. Simplified the drivers’ season ratings can then be understood as
(driver rating)=(driver pace)-(driver mistakes)
To help give some perspective for the ratings I made these tiers:
- S – above 89
- A – above 82
- B – above 73
- C – above 62
- D – above 50
- F – below 50
From going through all the data and seasons, I would say that generally a good season has a score above 73. Keep in mind, though, that there are no real cut lines.
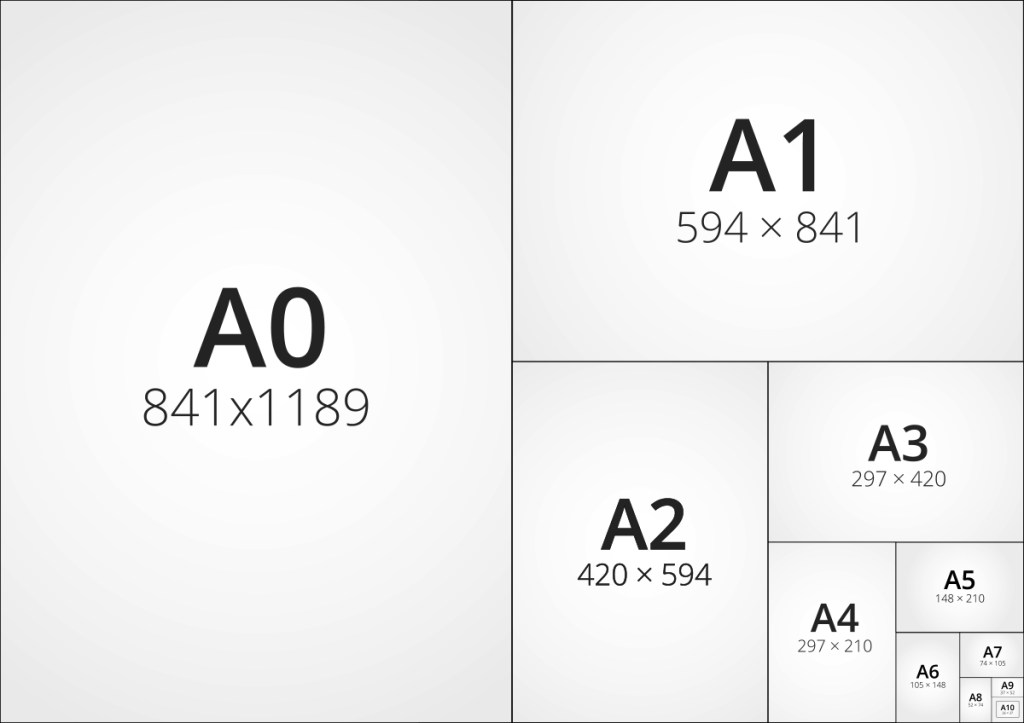
Below, all drivers that managed to score higher than the average of the era in question are listed. Each driver has their own entry including a short summary and an overall rating. This rating is derived by calculating a weighted average over all the seasons of this era, with the best season weighing as much as all the other lower rated seasons together, the 2nd best season in turn weighing as much as all the other lower seasons together, and so on; it works like the standardized A paper sizes.
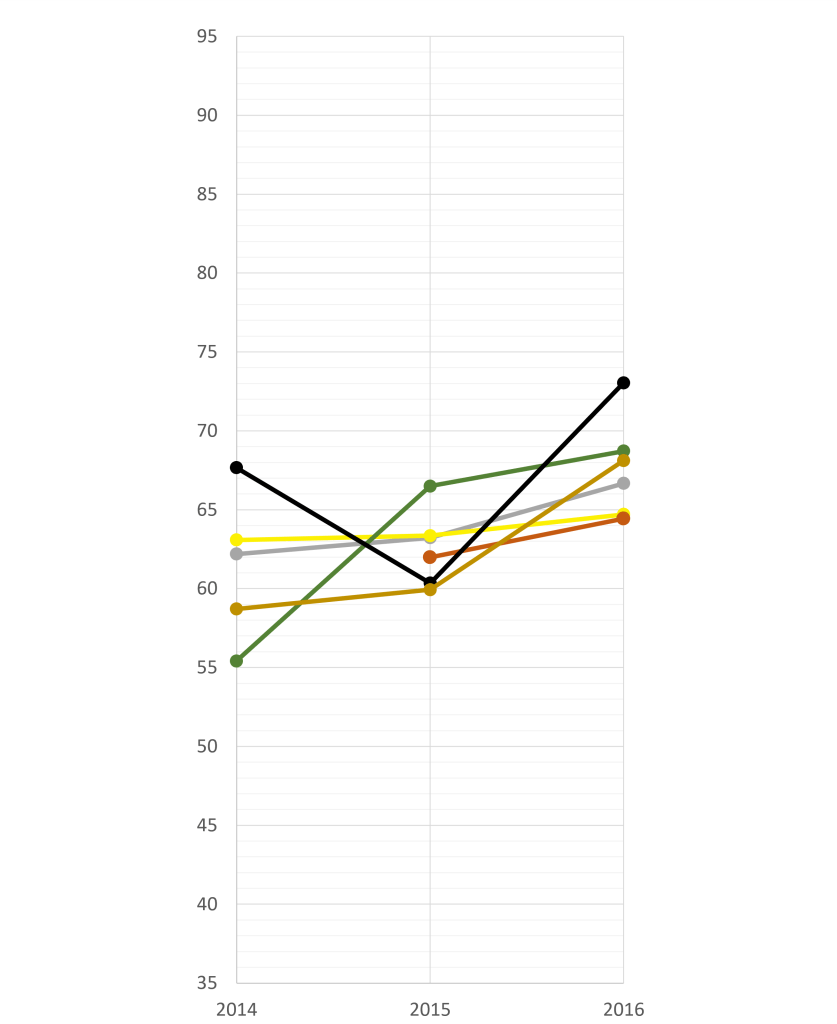
One of the advantages of this method is the adaptability concerning the number of seasons included. It allows for consideration of all seasons in the time frame, without majorly disadvantaging either those with more seasons, or those with fewer. Also included is a graph documenting the change of their season ratings and potential through the years. The potential roughly equates to pace and acts as a ceiling (moving with age and experience). It should give you a better understanding and context for the actual driver ratings in terms of underperformance, mistakes, consistency, speed etc.
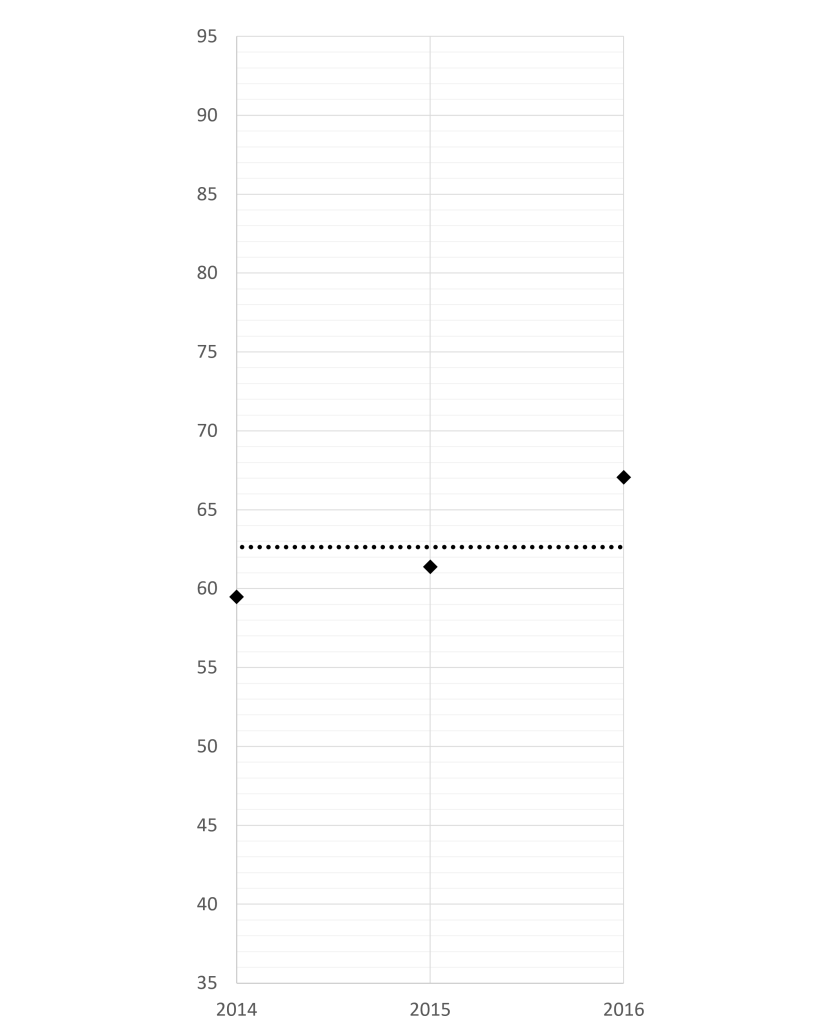
The Baseline
Through 2014-2016 the average driver would be expected at a score of 62.6 which is also around average historically. 2014 has the lowest rating, with a few drivers underperforming (Vettel and Button amongst them), possibly pointing to a systematic difficulty of getting used to the new cars. 2016 is rated 67.0, making it this era’s highest quality grid (and a generally above average grid), simply because all of the top drivers delivered. Over the 3 years of this era 14 drivers beat the average.
The “Above Average Assortment”
14 – Carlos Sainz
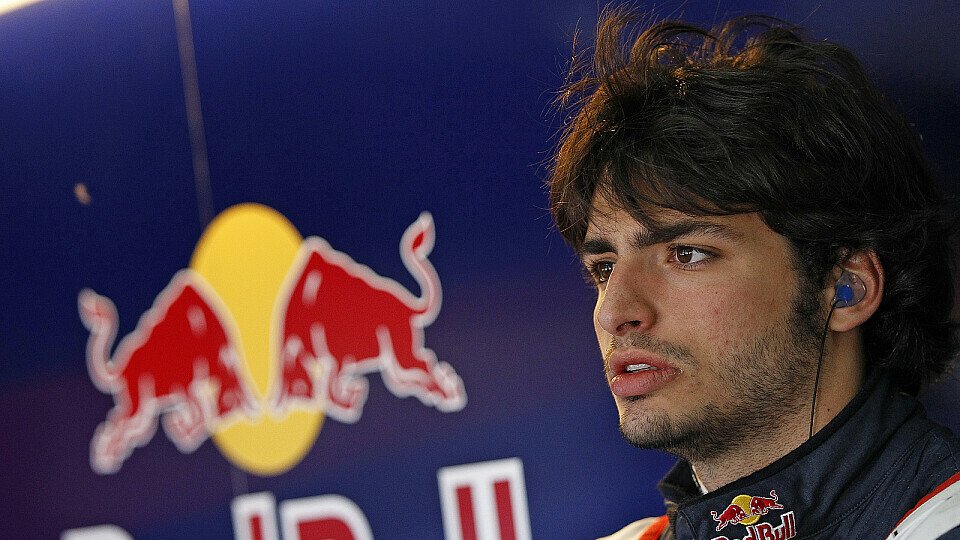
At the start of his F1 career, Carlos Sainz was completely overshadowed by the Hype surrounding his teammate Max Verstappen, eventhough he immediately showed promising results. While claims that he was able to match Verstappen in 2015 are clearly exaggerated, he did well for himself. When Red Bull swapped Verstappen for Kvyat, Sainz didn’t miss a beat and demolished Daniil to an at the time unexpected degree. Unfortunately for him, Reb Bull were (understandably) very content with their line-up of Ricciardo/Verstappen for the next couple of years.
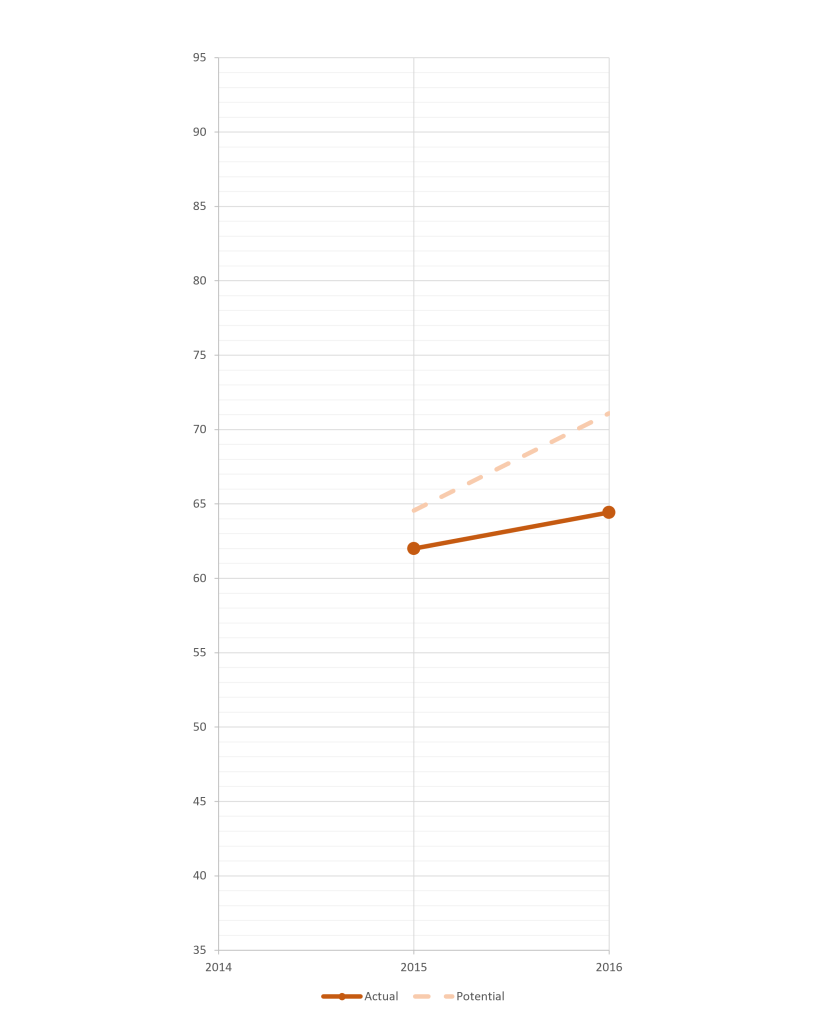
13 – Romain Grosjean

While 2014 and 2015 were more in line with his ususal performances, Romain Grosjean drove a surprisingly calm 2016. It is this season which gets him over the hump of the Baseline in this era.
Grosjean is often labled as “quick but crash-prone”, however, the model holds his ceiling at 70.6, and therefore far from quick, and barely decent. This difference in perception is likely linked to first and foremost Raikkonen’s 2012 being vastly overrated, and him beating the equally wrongfully labeled Maldonado.
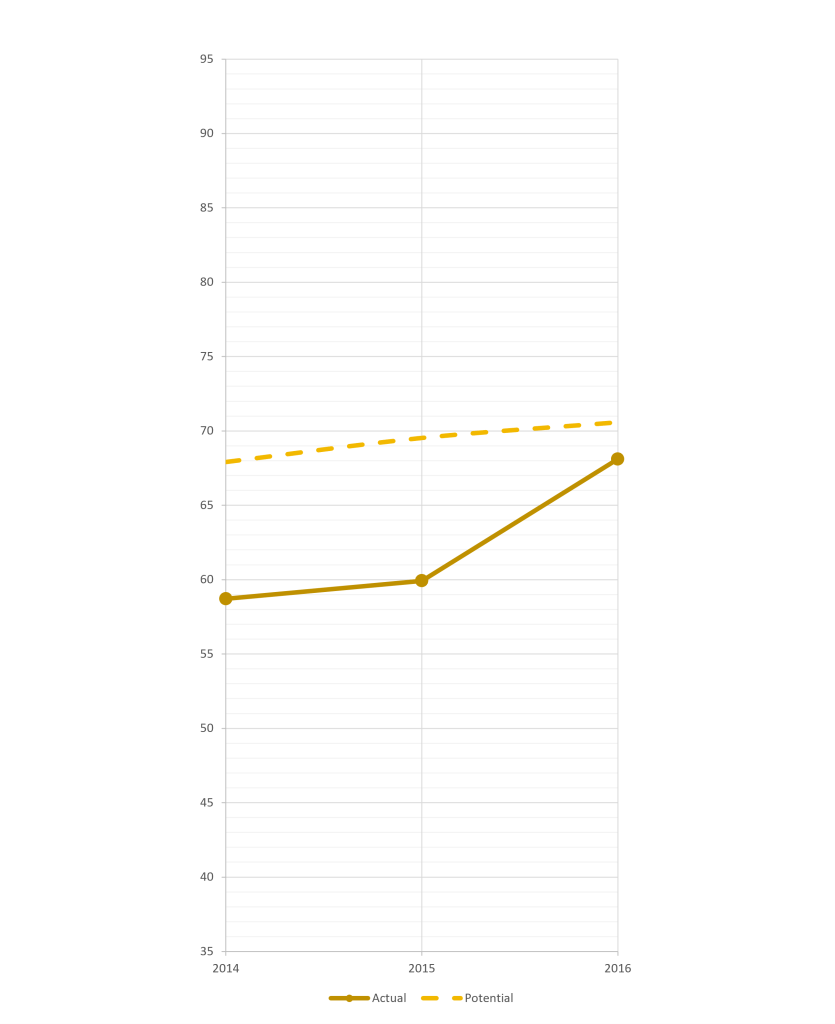
12 – Nico Hulkenberg


It might not be immediately obvious, but Nico Hulkenberg was one of a few drivers struggling in 2014. While he had a small advantage over Perez in 2015 and 2016, 2014 sees Perez ahead when the delta should have been at its biggest. Ironically, 2014 is also the only season he is overall rated higher than Perez.
Hulkenberg is not considered a very good driver. His potential is fine, reaching 74.6 at its highest point, yet unfortunately, Nico never really came close to that potential, as he was too erratic. Especially his Force India time is rather lackluster (visible in the continuously large gap between his rating and potential). He was mostly slightly quicker, yet, quite famously, Perez scored 4 podiums to Hulkenberg’s 0 over the course of 2014-2016.
11 – Valtteri Bottas

Valtteri Bottas looked good against Massa over these 3 years at Williams. He outscored the experienced Brazilian 407-308 and is rated quite a bit higher than Massa in every season. Bottas was still developing as a driver, and while he was relatively clearly ahead on pace by 2016, in 2014 the pair was evenly matched with a slight advantage to Massa.
However, this was not the same driver who went toe to toe with Kimi Raikkonen many years earlier. To many this won’t come as a surprise but the model finds a significant difference in Massa’s ceiling before and after his accident in Hungary, 2009. Originally, Massa’s ceiling was at 81.4, yet the Massa Bottas faced, irrespective of age, had a ceiling of only 67.4, marking a stark difference. Pre-accident Massa was a borderline WDC candidate, post-accident Massa was even on the lower end for an effective number 2 driver, and therefore it was no surprise that a mid-level number 2 like Bottas had the measure of him.
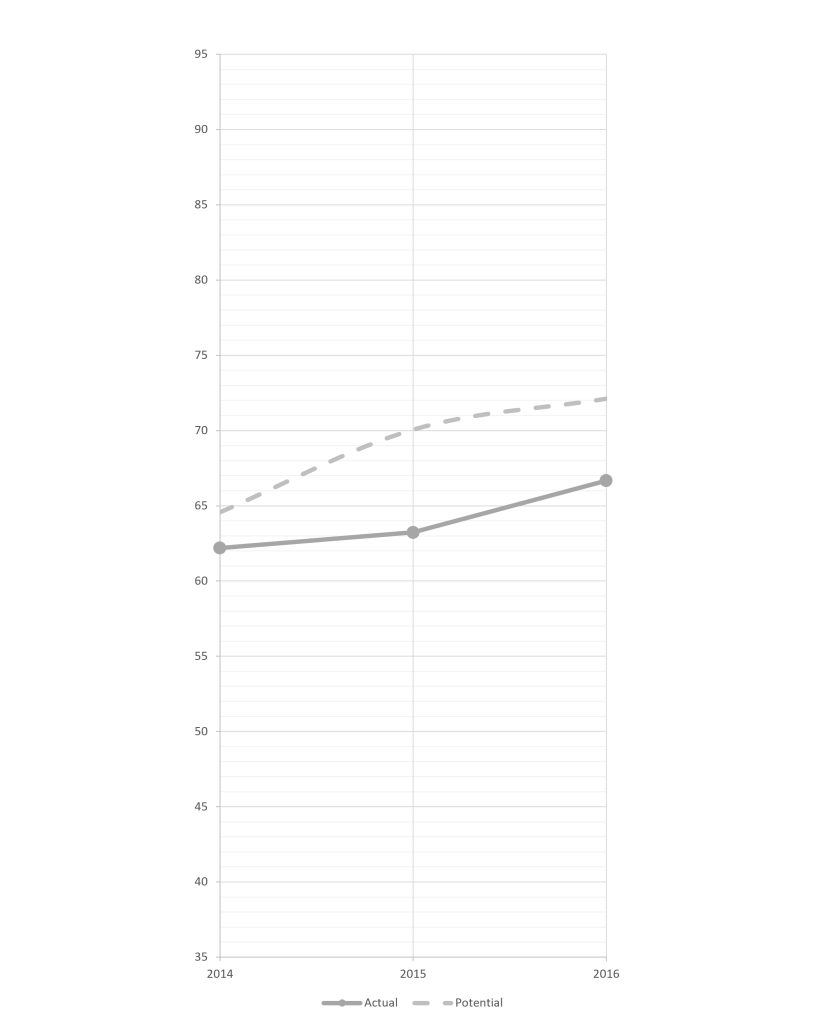
10 – Sergio Perez


Sergio Perez beat Nico Hulkenberg in 2 out of their 3 seasons together, both in the actual standings and the model’s ratings. He managed this by being an efficient points scorer, seizing opportunities better than his teammate, and being all around more consistent. However, Checo’s consistency doesn’t stand out compared to other drivers and is therefore more so a reflection on Nico Hulkenberg. Still, Perez found his way onto the podium every year in what was continuously the 5th best car throughout the era, which is very impressive in its own right.
9 – Kimi Raikkonen

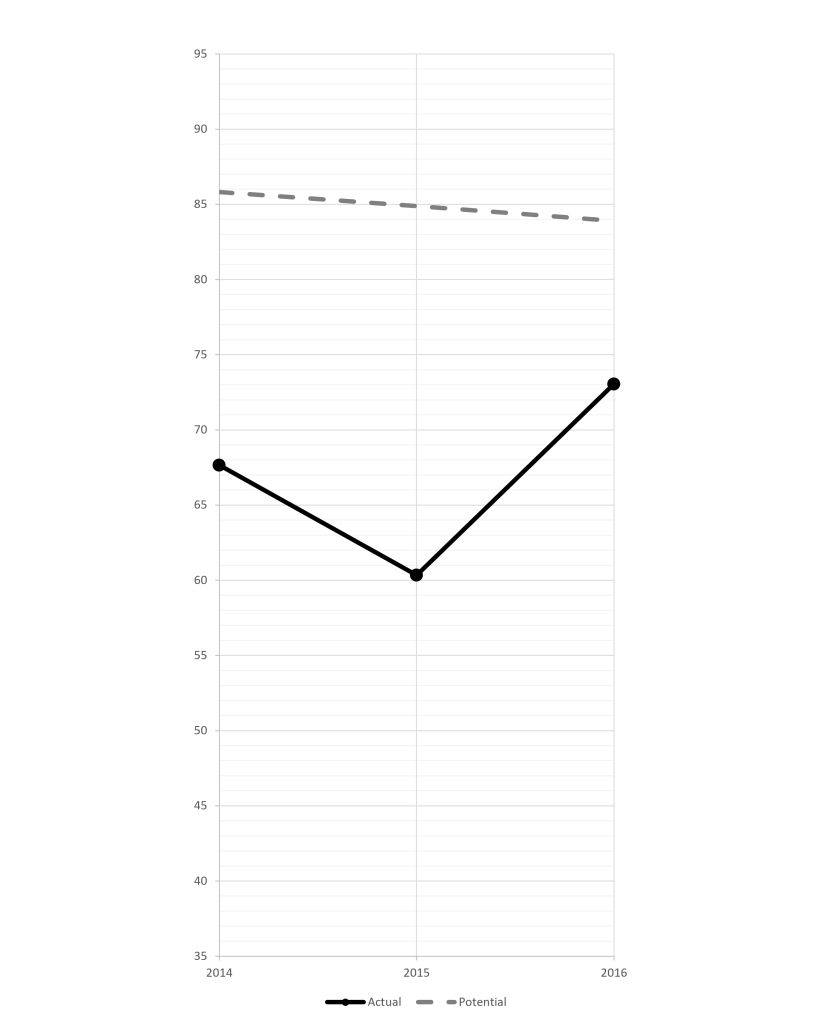
Kimi Raikkonen had a pretty good 2016. That is what’s heaving him a level above the other mediocre drivers.
The model finds Raikkonen to not be the same driver at this point, as he was in his prime. Therefore, the above shown line for his potential holds little value. Some of his later seasons seem to adhere to a different trajectory, though. Of his 2nd Ferrari stint, 2014, 2016 and 2018 match, with 2015 and especially 2017 being much weaker. Below, you can see what that new potential trajectory might look like. The x’s mark where the delta to his teammate would set his pace for each season.
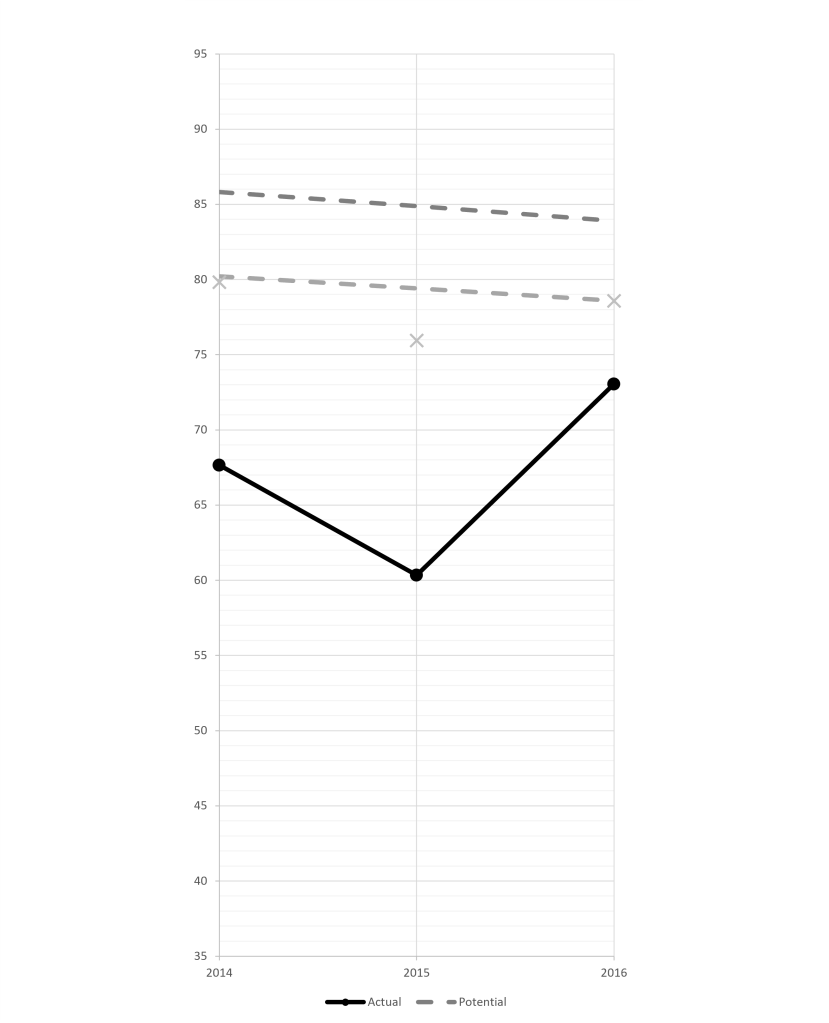
In a way, 2014 and 2016 show the difference between Fernando Alonso and Sebastian Vettel. While 2016 was undoubtedly Kimi’s better season, this comes down mostly to mistakes and singular terrible races. The general pace was quite similar in both seasons, yet one is remembered as a thrashing, while the other would be considered pretty good.
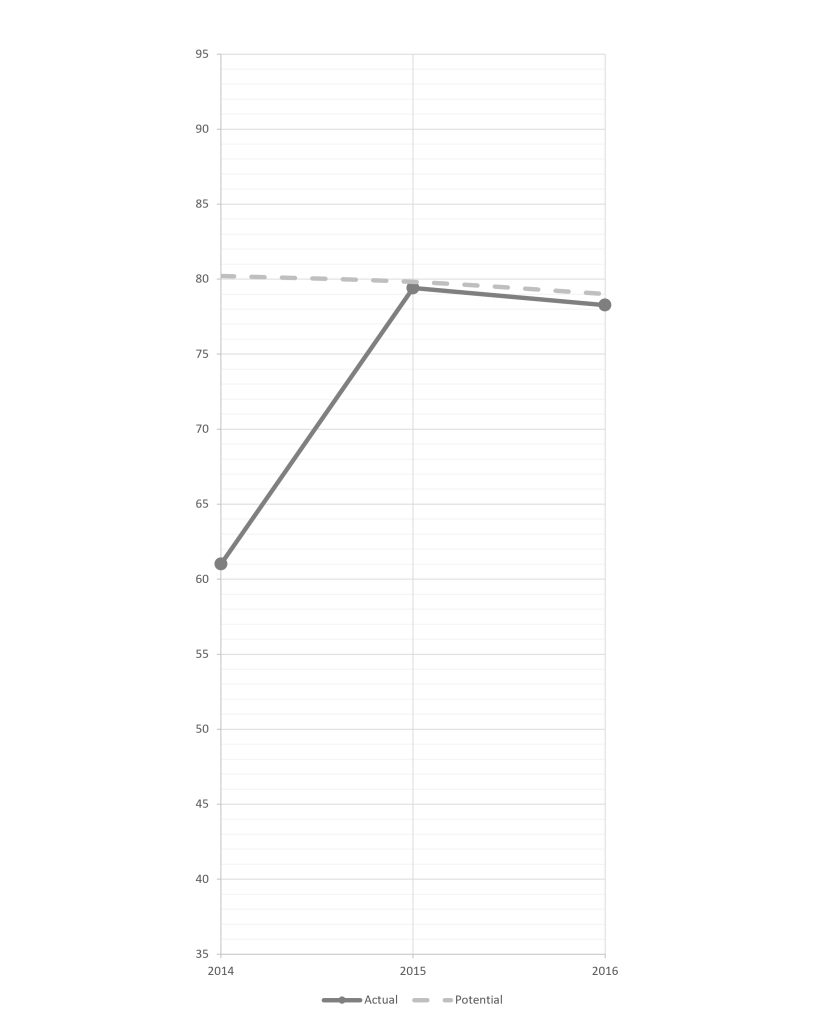
The “Good Ones”
8 – Daniel Ricciardo

Daniel Ricciardo performed superbly against Sebastian Vettel in 2014. With the knowledge of their whole careers, the model sees this as an underperformance by Vettel in 2014 and predicts Seb to be slightly ahead under normal circumstances.
Then Daniel turned around and did the opposite in 2015. He underperformed on 2 levels. For one, he lost the points head-to-head, arguably a bit unlucky, while clearly having a pace advantage. Secondly, that pace advantage was not nearly big enough to comply with the model’s expectations. Daniil Kvyat is not considered as a good driver. His ceiling lies at 70.6 and in 2015 he was far from that, being only 21 and in his second season.
Theoretically, the deltas would put Ricciardo’s potential around 88 in 2014 and around 68 in 2015. With hindsight, it is clear that neither season was directly representative of Daniel Ricciardo’s true skill level.
7 – Jenson Button
/origin-imgresizer.eurosport.com/2015/11/26/1739942-36797046-2560-1440.jpg)
Like Vettel and Hulkenberg, Jenson Button seemingly had a tough time with the new regulations in 2014. His underperformance had the highest degree of the trio. It was not clear at the time since Magnussen was a clean sheet but it is clear now.
2015 and 2016 were challenging seasons as the McHonda partnership proved to be… difficult. It seems that Button made the most of it, though. 2015 and 2016 are two of the highest rated seasons of his career. The obvious caveat being that the frequent technical problems rendered many races worthless.
6 – Jules Bianchi


Don’t take this too seriously. Jules Bianchi has no real connection to any driver apart from Max Chilton. Max Chilton has only one connection himself, to Bianchi. That means, Bianchi could not be rated by the model, since he is completely isolated. I played around with F2/F3 and found that there is some evidence that the adjusted (for age and experience) deltas found by the model can also be found between teammates in the junior categories. I went ahead to look at the junior record of one of the biggest what-ifs in recent history and puzzled around him with every driver I had from the model. The resulting ceiling (plus age and experience effects) was then applied to his 2013 and 2014 seasons. Of course the uncertainty around Bianchi is much higher than normal and his rating should be viewed with extra caution. Apart from that, there is no guarantee that the deltas would be the same in F1. Since Bianchi is on an island, his inclusion has no effect on anything else and is therefore harmless.
After all of this, Bianchi’s ceiling would be similar to that of Vettel or George Russell (86), suggesting that, had he lived and gone to Ferrari, his accomplishments would be similar to what Vettel achieved in reality.
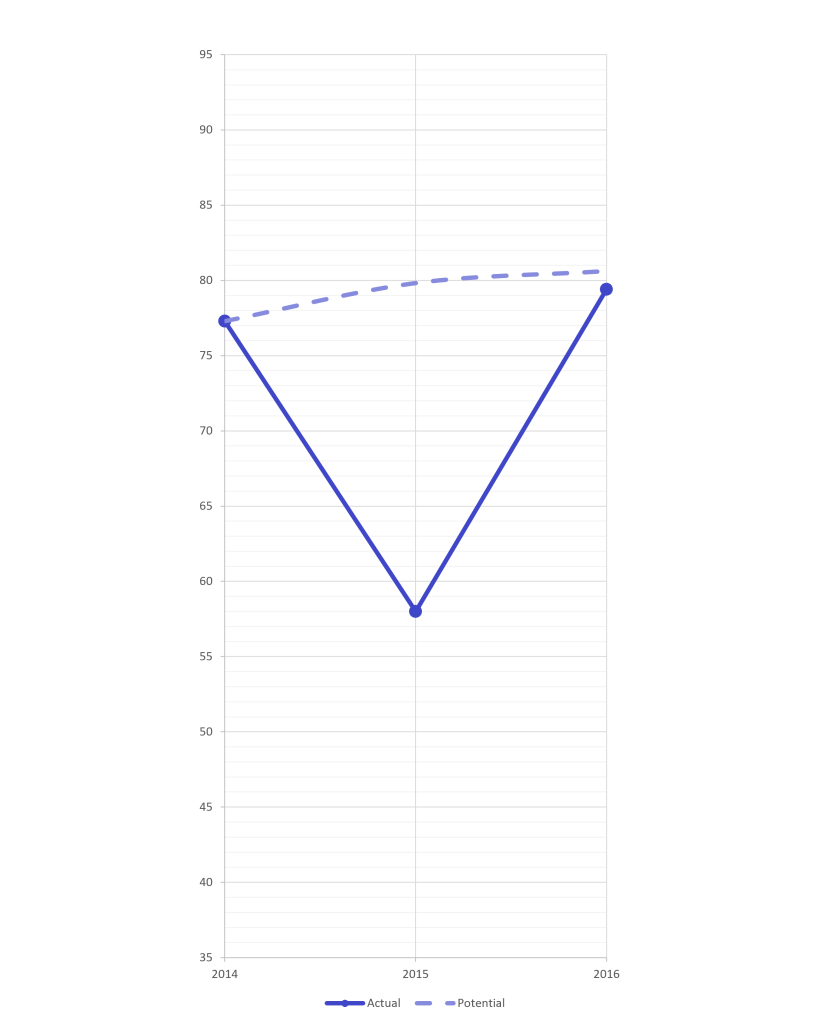
5 – Max Verstappen
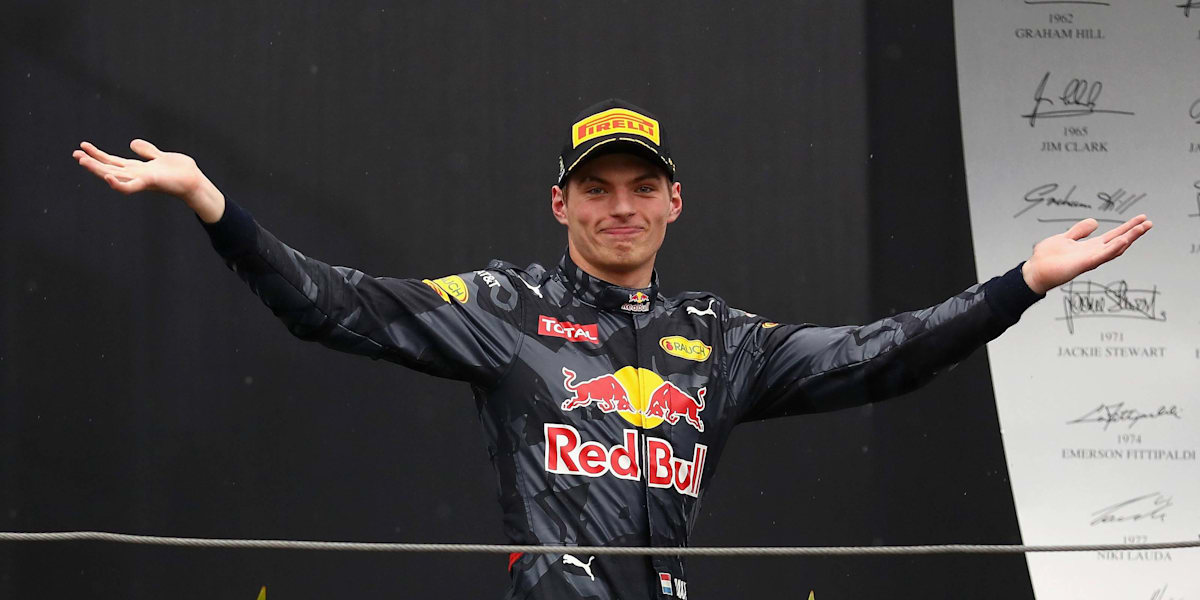
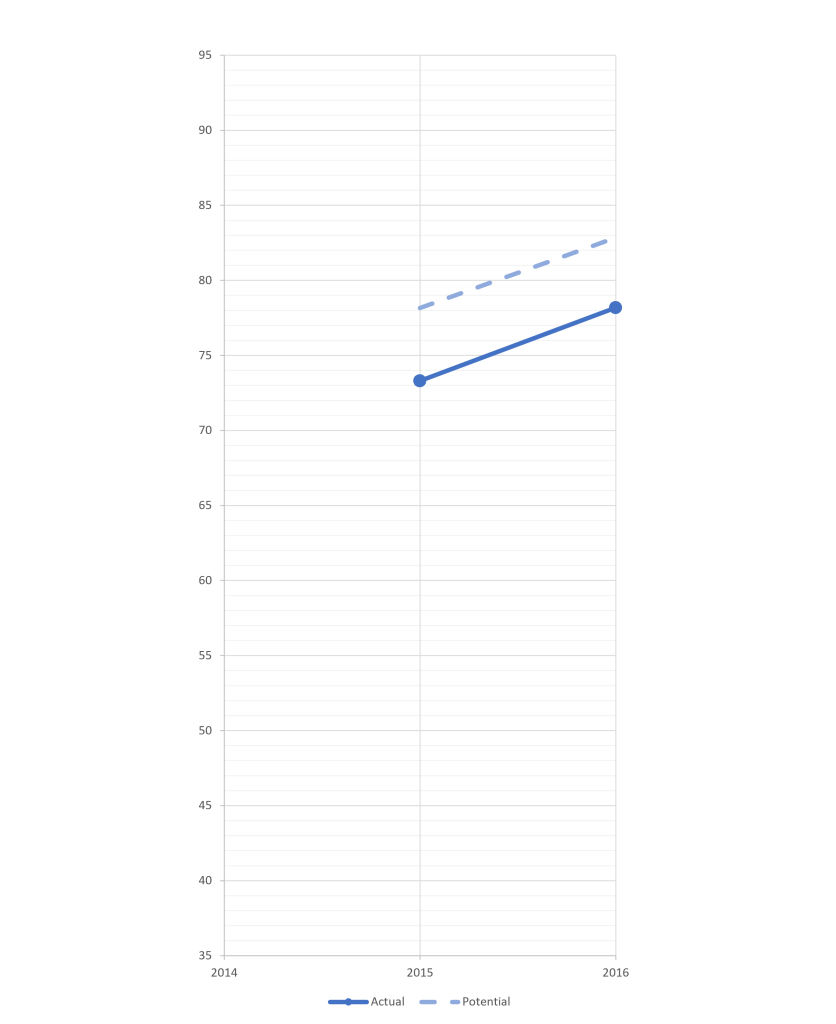
Max Verstappen debuted at only 17 years of age. The model sees him as surpremely talented with a ceiling of 93 and the only reason his rookie season isn’t among the absolute best of all time is that exceptionally young age. Still, Verstappen immediately slotted in as one of the top drivers on the grid, finishing the season as the 6th highest rated driver of 2015. However, this is also partially down to the quality of the grid at the time. Oscar Piastri’s rookie season is rated lower than to Max’s (67.2, while being 4 years older), yet it would have made him 6th in 2015 as well. Meanwhile, it left him outside the top 10 highest rated drivers of 2023.
In 2016, he is actually found to already have higher potential than Ricciardo (that is to say, he had more pace) but overall he could not yet outscore Daniel.
Max is rated ahead of Button and Ricciardo here because both of them had a major off-season in the mix; something Verstappen has remarkably avoided to this day.
4 – Sebastian Vettel
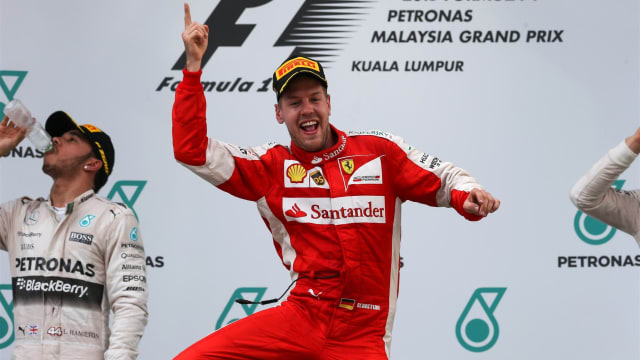

Sebastian Vettel should be amongst the “Greats”. Even if he wasn’t on the level of Alonso and Hamilton, he was a step above the rest. Unfortunately, like surprisingly many of his competitors during this era, he had one subpar year. 2014 taints what is otherwise a very strong stretch of seasons.
His 2016 is often underrated due to the much smaller margine over Kimi Raikkonen, but as per Kimi’s entry, the model shows that 2015 was more likely a big underperformance by the Finn. Couple this with the Red Bull drivers not delivering in 2015 and the chasm between Seb’s 2015 and 2016 seasons seems much more pronounced than it should be.
3 – Nico Rosberg
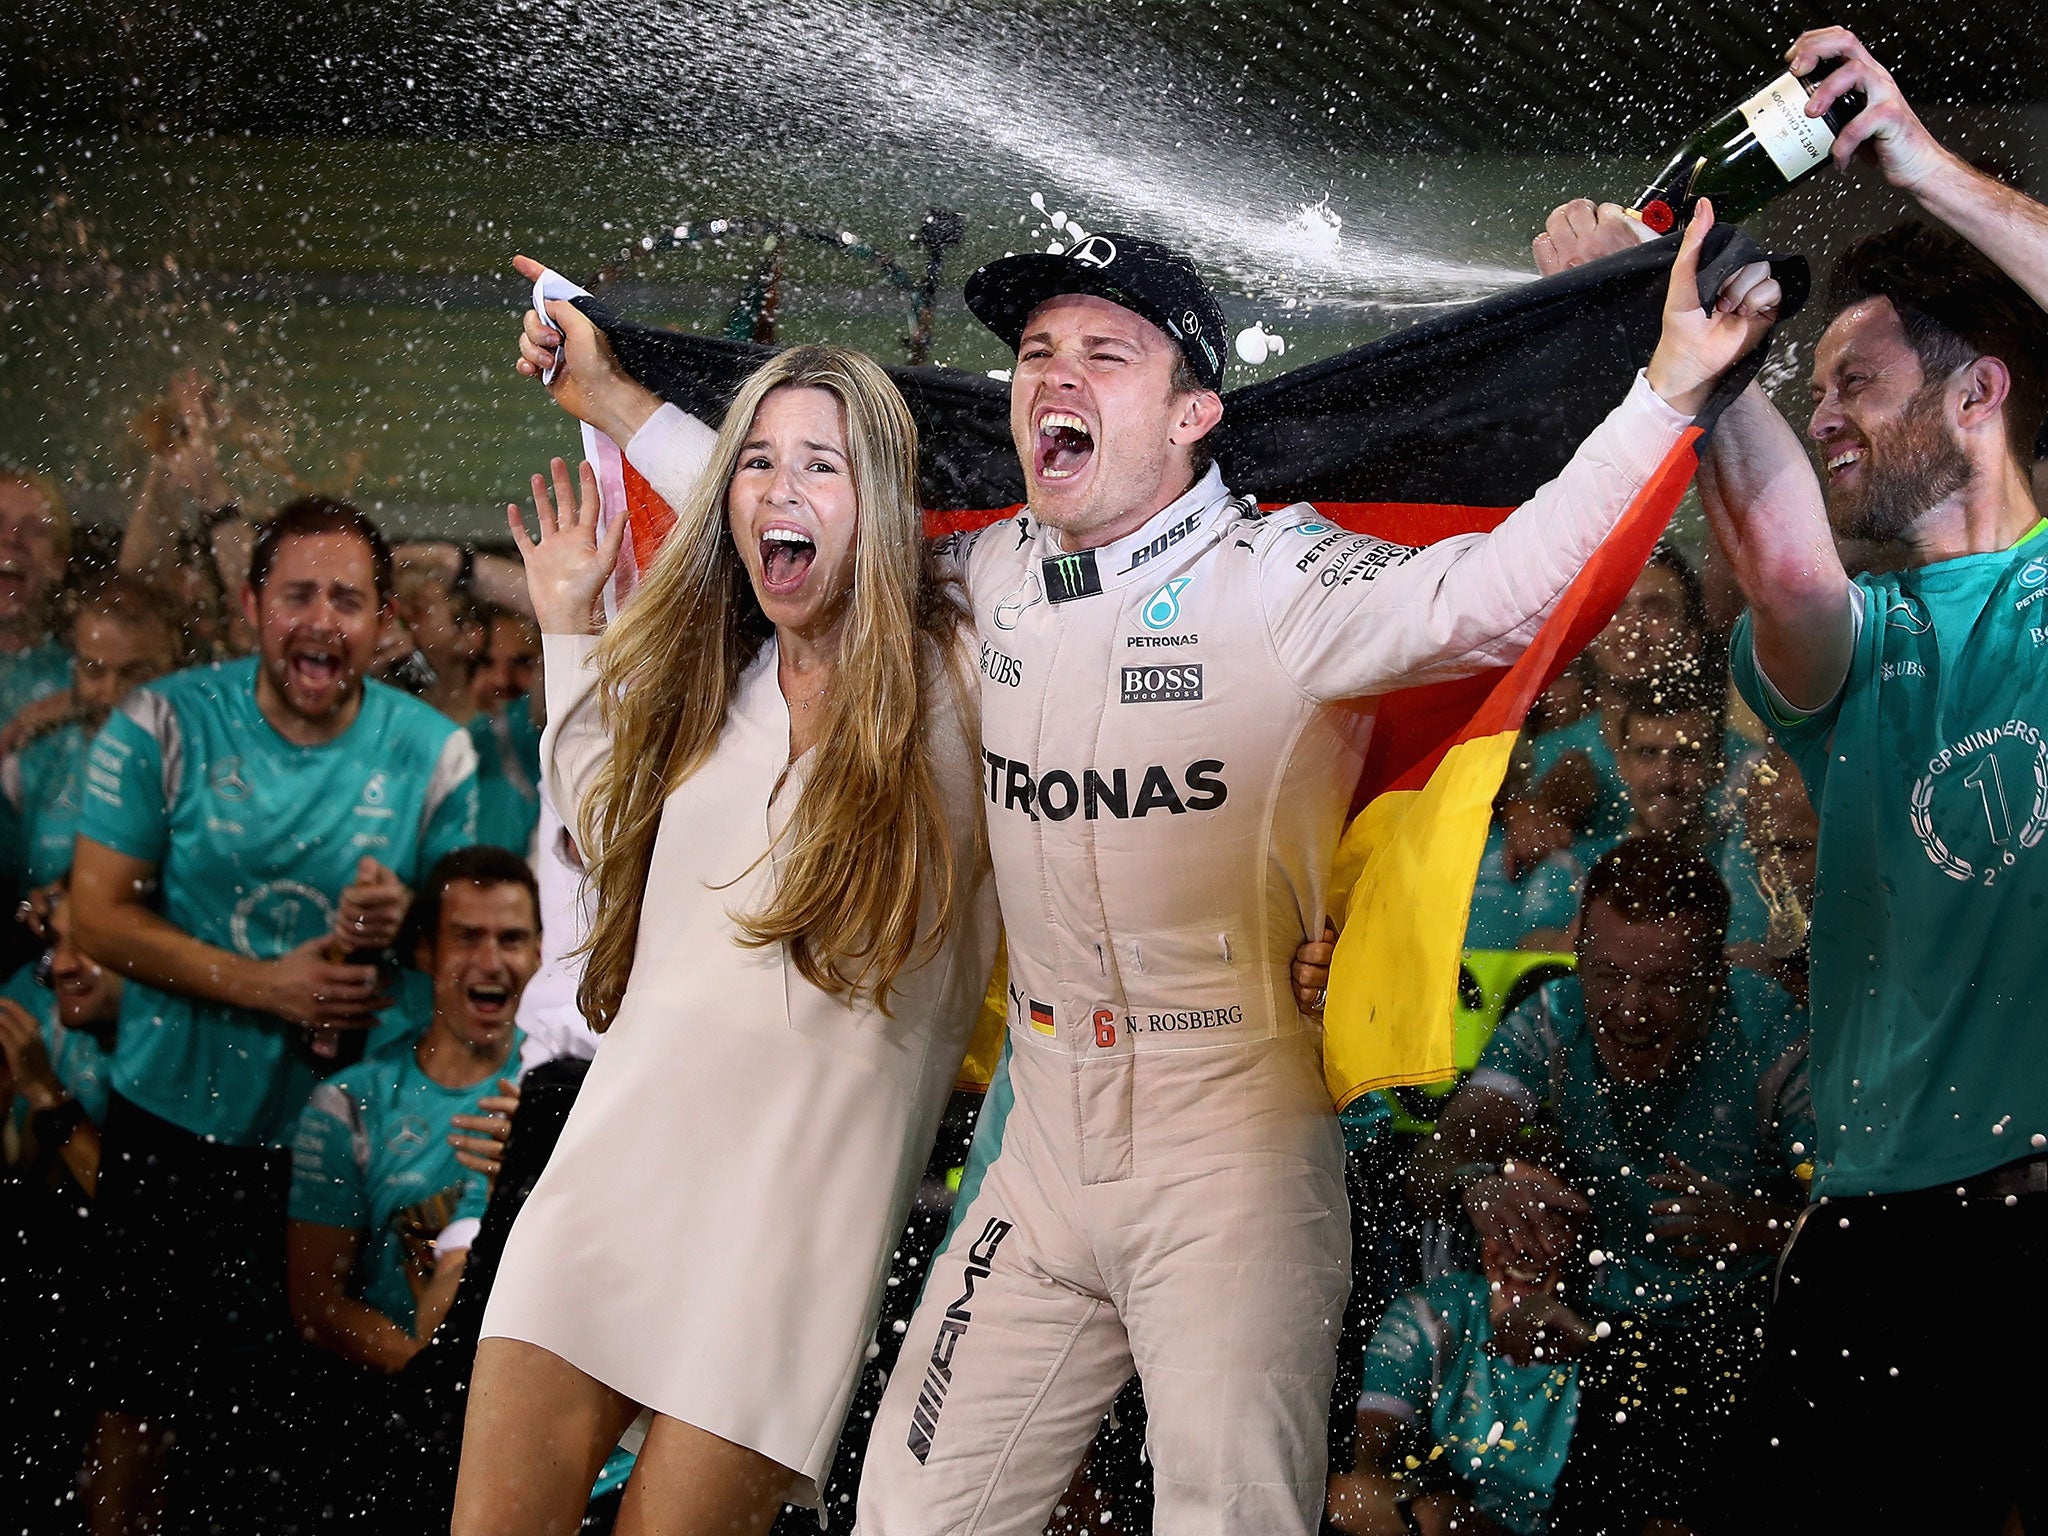
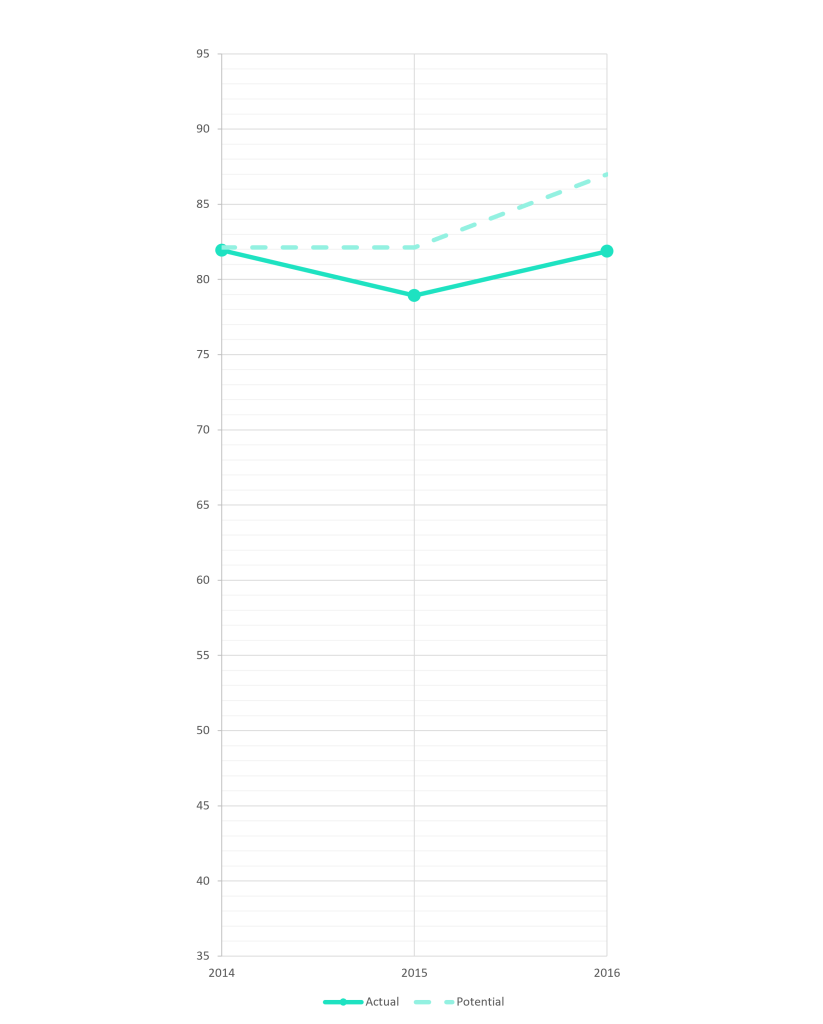
Nico Rosberg is about the highest a driver could be rated before you would start calling them great. He had one season of greatness in 2016, though. That year, the delta to Hamilton is smaller than expected. Normally, this would default to a Hamilton underperformance but with everything we know about Rosberg in 2016, it seems very likely to actually be a rare overperformance. The delta would put his pace around prime Kimi Raikkonen level for that one year, jumping from his usual 82.1 ceiling to 87.0.
Curiously, 2016 is not Rosberg’s highest rated season; 2014 is (albeit by slim margin). In 2014, Rosberg was driving almost perfectly to his ceiling. Unfourtunately for him, so was Hamilton. If it wasn’t for uneven reliability at Mercedes, Nico would never have had a chance at the title. In 2016, he is much closer to Hamilton on pace but he had bad races dragging him down. The difference is that he was quick enough to put pressure on Hamilton, maybe leading to mistakes from the Brit. That results in Hamilton and Rosberg being rated much closer to each other in 2016 (gap of 4.3), than they were in 2014 (gap of 8.3). Unlike in 2014, this enabled Rosberg to win the championship with some favourable relaibilty in 2016.
The “Greats”

2 – Fernando Alonso

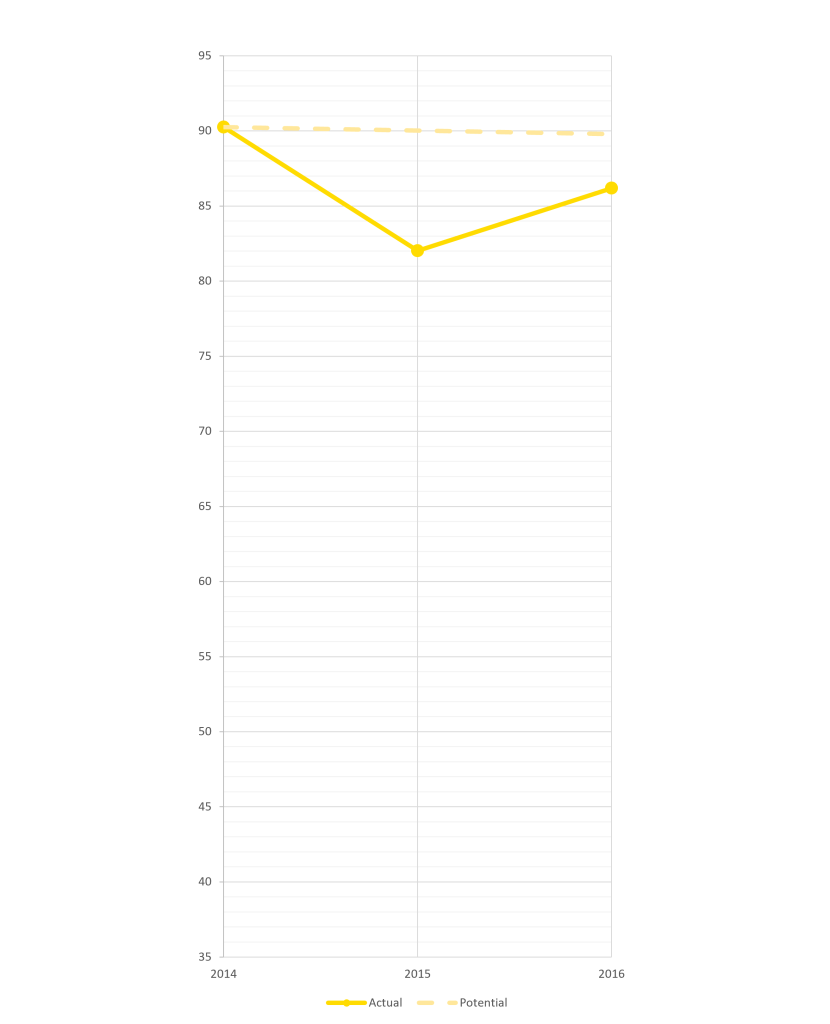
McLaren should be tried for their crime of sticking Fernando Alonso in a backmarker for half of eternity; or maybe it was atonement for 2007?
Alonso and Hamilton have almost identical ceilings, and between 2014 and 2016 they scored very similarly. In an alternate reality, where Alonso drove for Mercedes and Hamilton stayed at McLaren, the results would be almost the same, according to the model.
As mentioned in Raikkonen’s entry, Kimi’s performance against Alonso in 2014 and Seb in 2016 deliver a good and relatively direct comparison between the two. In clean races, Alonso and Kimi would split the points 60-40, while Seb would only best this Raikkonen 56-44, showing that Alonso and Hamilton were a clear step ahead of the rest at this time.
The model finds 2015 to be a significant underperformance by Alonso. His delta to Button is barely there at all, while adhering to expectations a year later. This might have been a consequence of getting zapped in testing. As for Button, these two seasons have a certain caveat. This is especially true for 2015, with the car being so incredibly uncompetitive (see the teams section further down) and unreliable, and all those carried over engine penalties.
1 – Lewis Hamilton

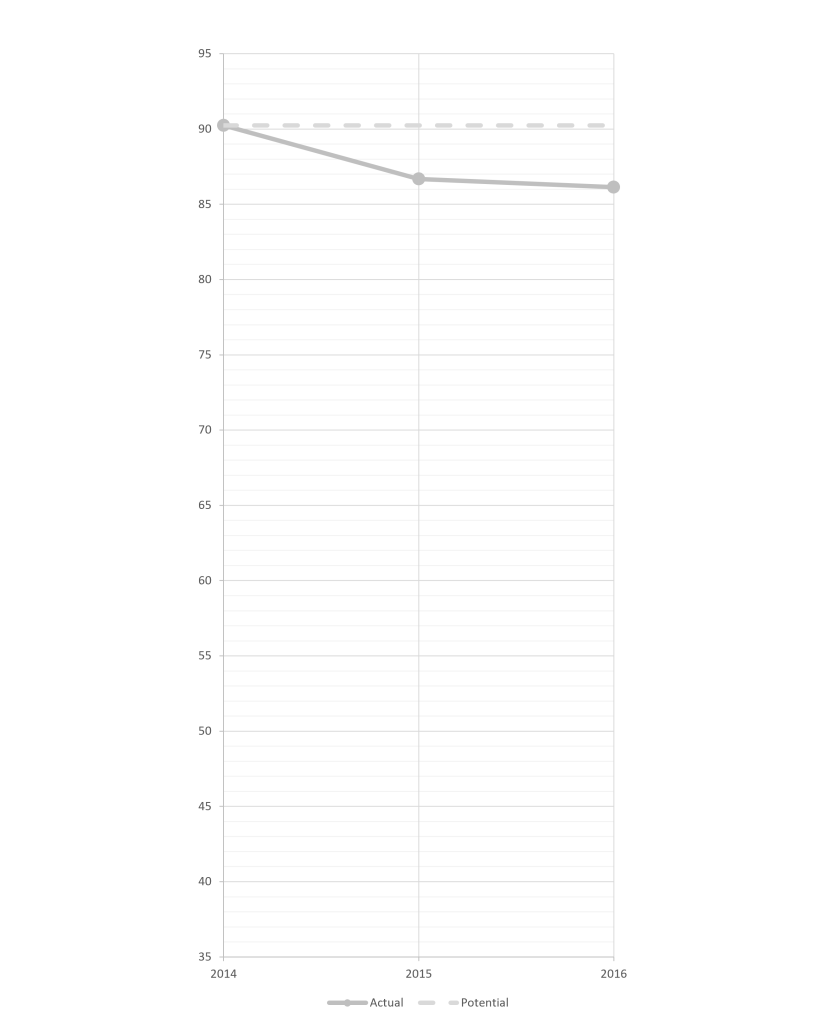
This was Lewis Hamilton’s prime. Some argue for a changed, better Hamilton after his defeat to Rosberg in 2016 but according to the model, there is no evidence for this. In 2014 and 2015 he almost dog-walked one of the best drivers on the grid in Nico Rosberg, beating him 22-9 in counting races, and made next to no mistakes over those 2 years. They only started to creep in more by 2016, arguably due to Rosberg forcing them. 2018 on the other hand, is a completely singular outstanding season, preceded and followed by much weaker years.
Hamilton’s ceiling (90.2) is unsurprsingly among the highest in F1 history, making him a shoo-in for the top 10 greatest drivers of all time (currently 7th, 1969-today). However, he doesn’t quite get as high as Schumacher (93.2), Senna (93.6), or Verstappen (92.9), pretty much taking him out of the GOAT conversation as far as the model goes.
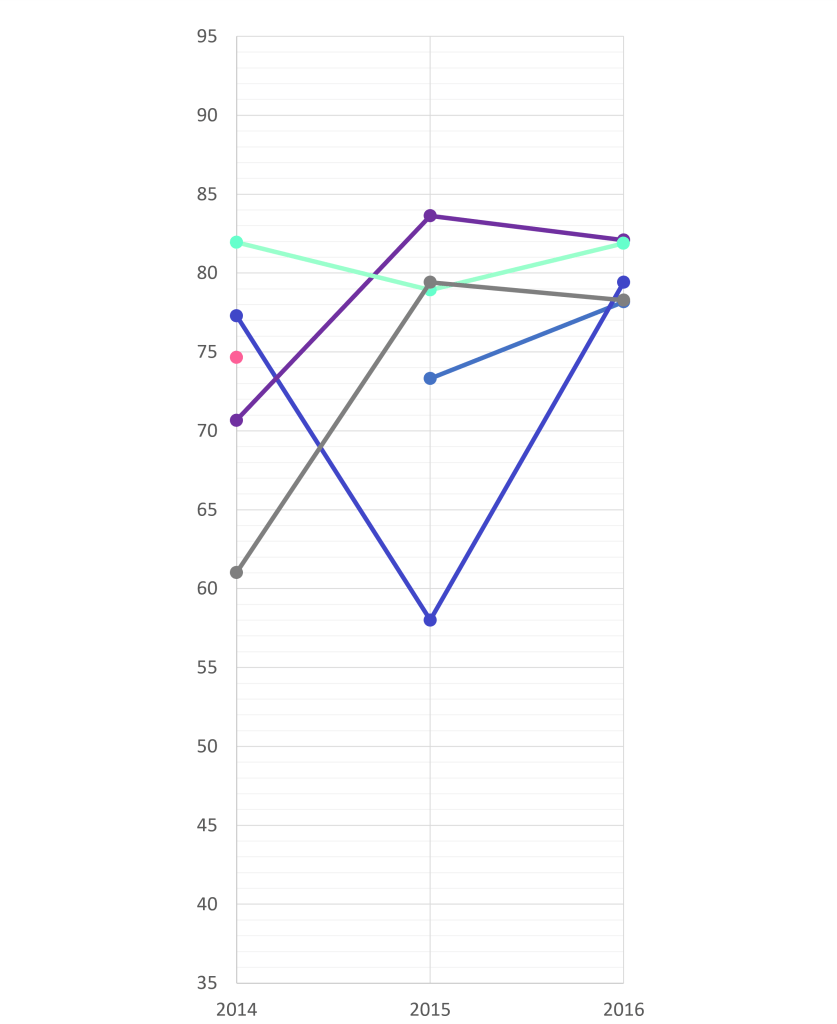
The Whole Picture
Below I included the annual team principals ratings for comparison. Some observations:
- There seems to be a general adherence to the points standings, most obvious in Alonso’s and Bottas’ rankings through the years. If you compare Bottas’ rankings by the team priciples to the team scores a bit further down, you’ll notice that their trajectories line up.
- Expectations play a big role, visible in Verstappen’s and Kvyat’s ranking.
- Inconsistent criteria have to be expected since, at the end of the day, the team principles are also just humans, ranking mostly on subjective opinion, and on top of that, they are obviously not one entity but 10 different people (and not even the same 10 every year) with different views.
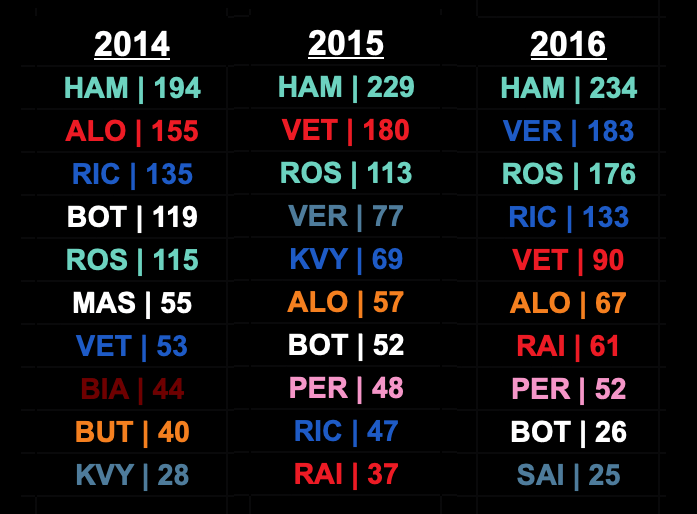

Lewis Hamilton in 2014 and Fernando Alonso in 2014 hold the highest rated seasons of this era (90.2). The 3rd highest rating belongs to Hamilton in 2015 (86.7), 4th to Alonso in 2016 (86.2) and 5th to Hamilton in 2016 (86.1). The two of them completely domintated this era in the model. Only Sebastian Vettel in 2015 managed to break into the top 2 with the 6th highest rating (83.6), aided partly by Alonso giving up at McHonda. Both 2014 and 2016 are shared titles by the duo, making Hamilton the (possibly) highest rated driver in all 3 seasons.
This diagram also shows quite nicely, why ratings are more important than rankings. Take Max Verstappen for example, who is ranked 6th in 2015, and 7th in 2016, while actually improving well from one year to the next.
There were many bad (below 50) performances in this era. The lowest scores belong to the 2014 backmarkers Ericsson (24.7) and Chilton (27.2). The third lowest score goes to Daniil Kvyat in 2016 (35.1), who seemed absolutely broken after the swap.
A Quick Look At The Teams
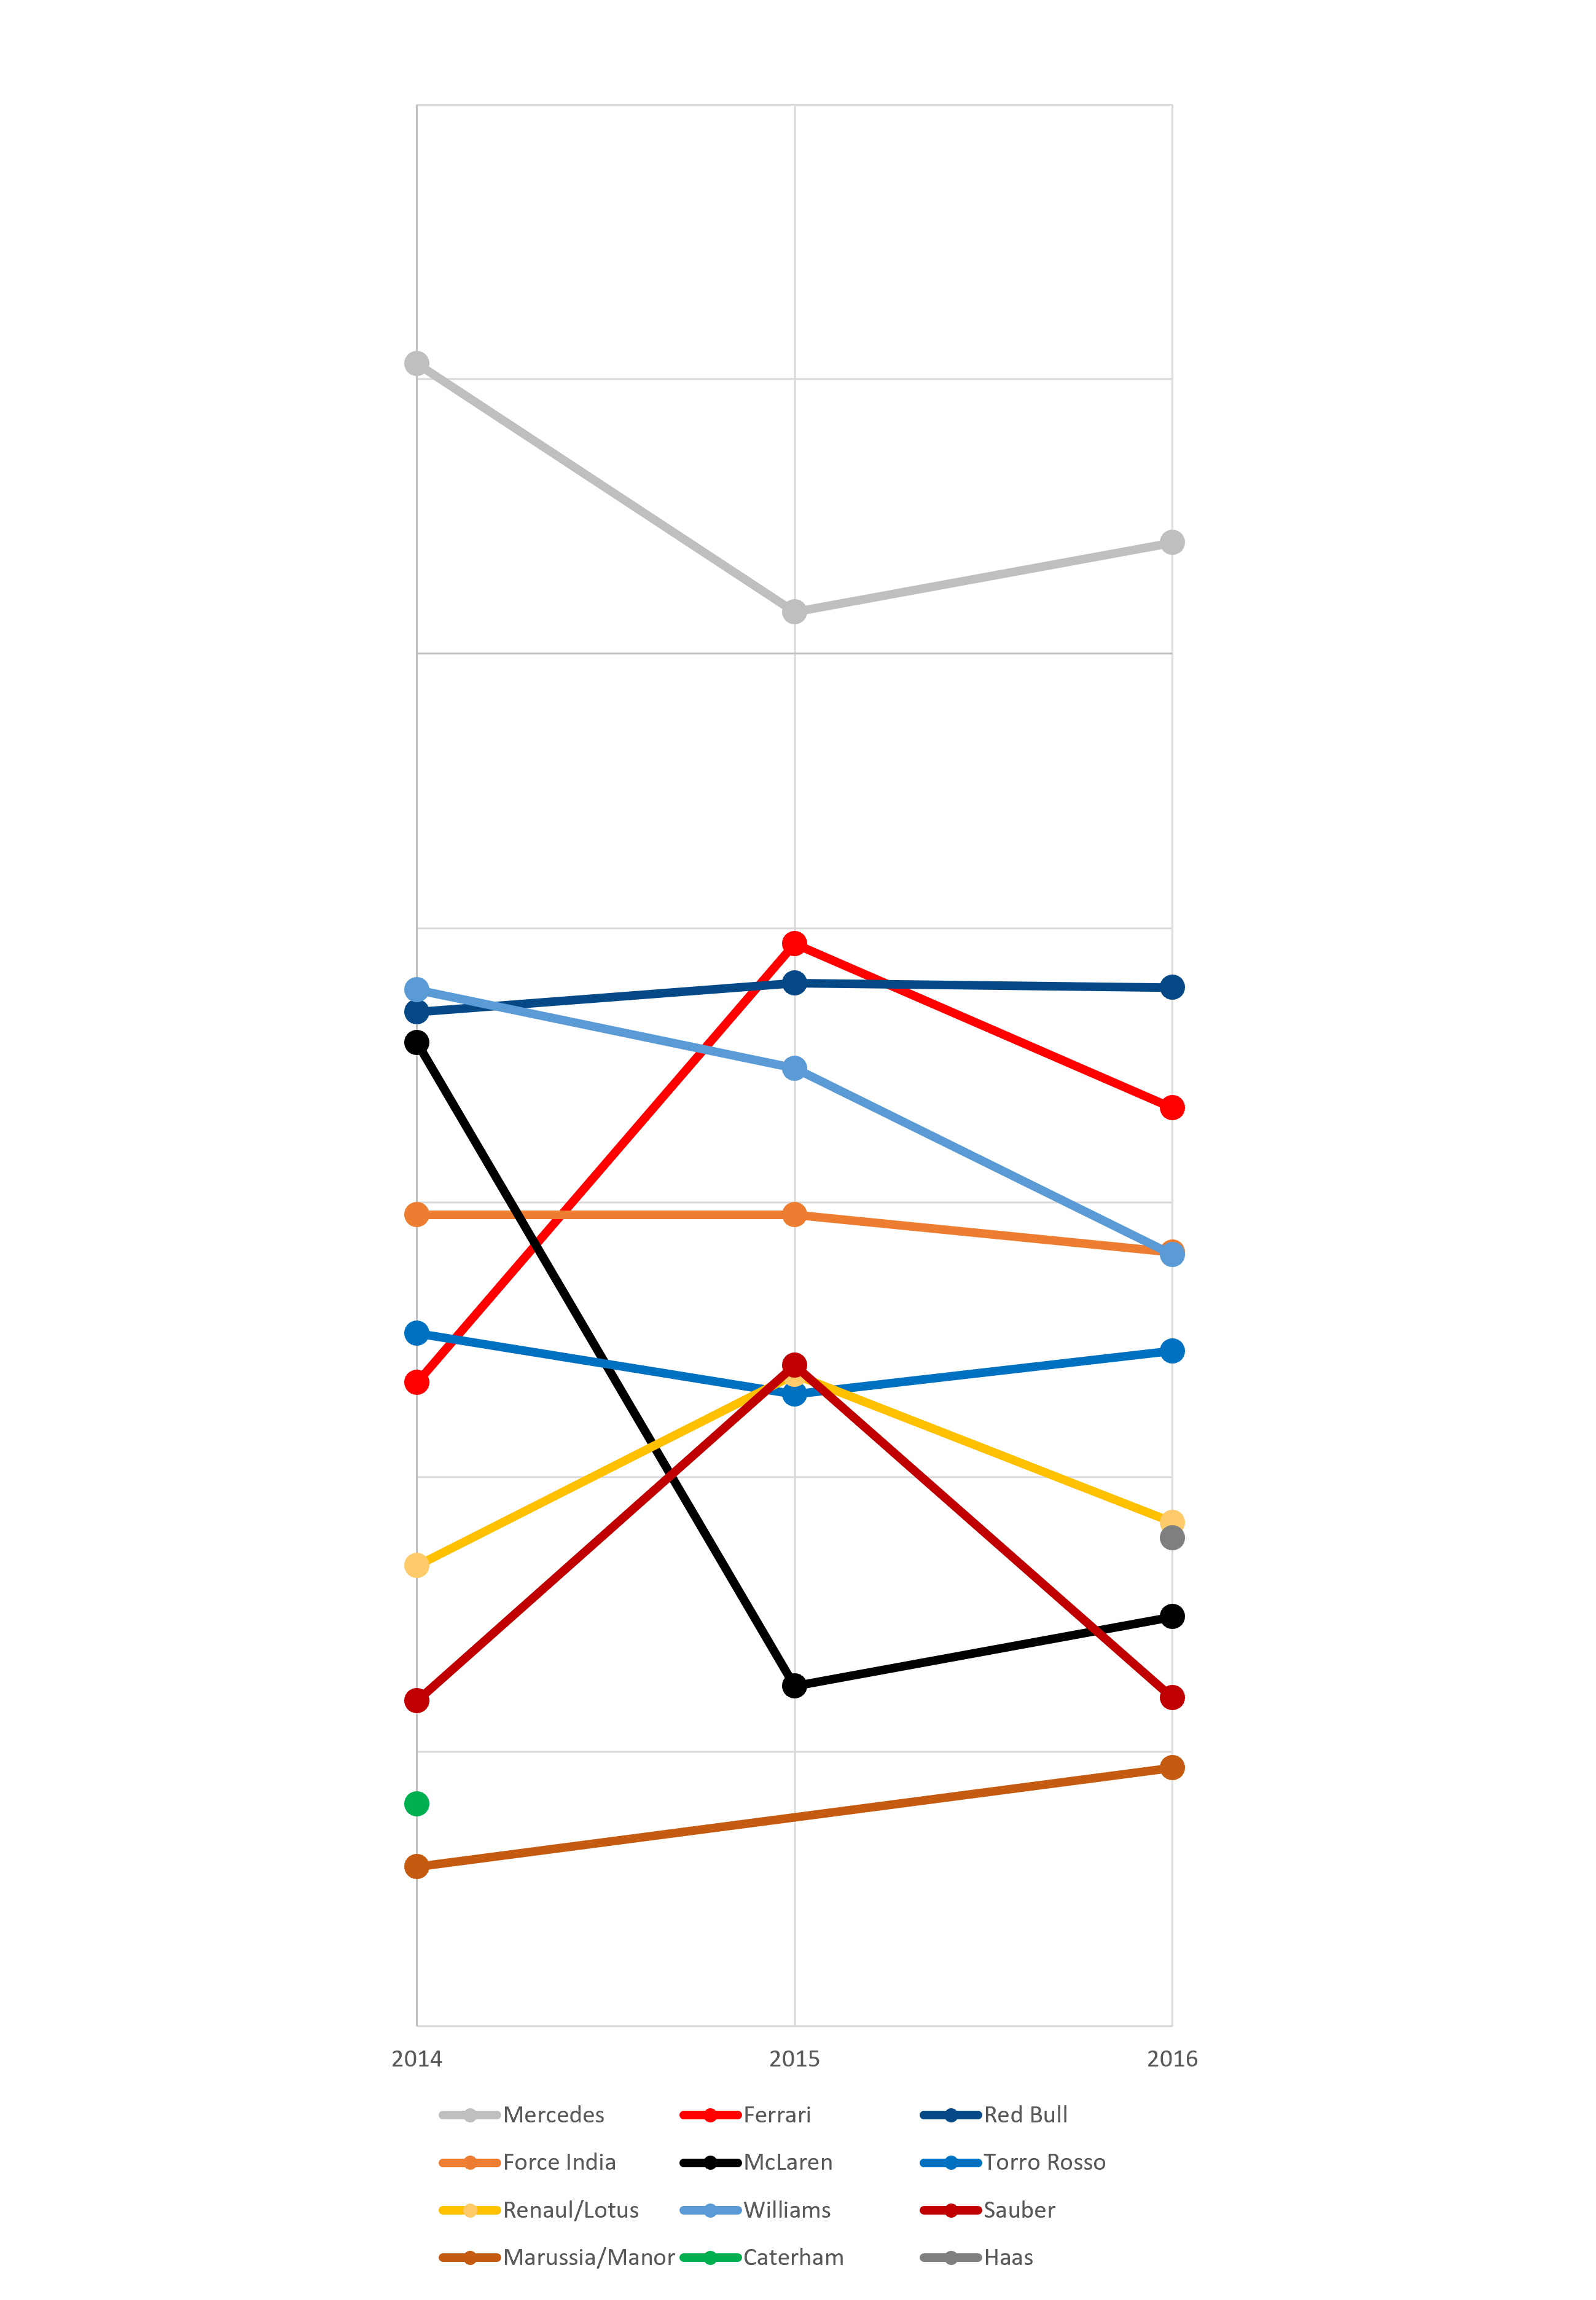
The word dominant gets thrown around quite a lot these days but Mercedes truly dominated this era. The 2014 W05 is even rated as the greatest winged car in Formula 1 history (since 1969) by the model. McLaren’s switch from Mercedes to Honda engines is also clearly visible.
Especially at the time, the 2015 Torro Rosso was heralded as a stand out car. The James Key designed machine scored 67 points in 2015 in 19 races compared to 30 points in 19 races the year prior. This effect was accentuated by Red Bull going from 405 points to just 187. The model finds no significant difference in competitiveness throughout the era for either team, though. Instead, a supreme all-rookie line-up of Verstappen and Sainz at Torro Rosso coincided with a down turn in form by Daniel Ricciardo, paired with a weak Kvyat at Red Bull.
The Manor Marussia drivers of 2015 have no outside connection and therefore produce no rating.
We had some amazing driver pairings from 2014-2016. The obvious one at the front and the sad one at McLaren. Basically, any pairing including Hamilton or Alonso is considered very good at the least. The 2014 edition of Ham/Ros even makes the list of the best driver pairings of all time. Both were extremely consistent and drove at a very high level, yet Rosberg was far enough from Hamilton to almost fall into a number 2 role (if it wasn’t for reliability).
- 2014 – Hamilton/Rosberg – 86.6
- 2016 – Hamilton/Rosberg – 84.1
- 2015 – Hamilton/Rosberg – 83.3
- 2016 – Alonso/Button – 82.6
- 2014 – Alonso/Raikkonen – 81.5
- 2015 – Alonso/Button – 80.7

Leave a comment