
While the 2024 Formula 1 season started like 2023 ended, it quickly developed into one of the most competitive seasons in recent memory on a race to race basis. 4 constructors won at least 4 races each, with 7 different drivers taking the top step, and the drivers champion drove for third place in the constructors championship – sounds better than 2012. Was it? The mathematical model seeks to eliminate the factor car by only measuring drivers against their teammates.
How Does It Work?
My model was inspired by the amazing f1metrics model and therefore shares a significant portion of its methodology.
Step 1 was to introduce a unified points system. P1 gets 10p, P2 gets 10p*0.72=7.2p, P3 gets 7.2p*0.72=5.18p …. etc. all the way to P20. Driver related DNFs are scored with 0p.
Then the 2 teammates get their points assigned for every race. Races where one driver has mechanical issues are excluded (or corrected if possible). Driver errors and other incidents are also excluded (or corrected if possible). Now the points are tallied up and converted on an s-curve. The difference between the two values of the drivers is the performance difference between them.
In combination with functions for age and experience (I use those of the f1metrics model), doing this with all drivers over a lot of seasons, results in a pretty sturdy web of relative driver performances. While building this web, I am not looking for a compromise of all seasons but instead a most perfect fit.
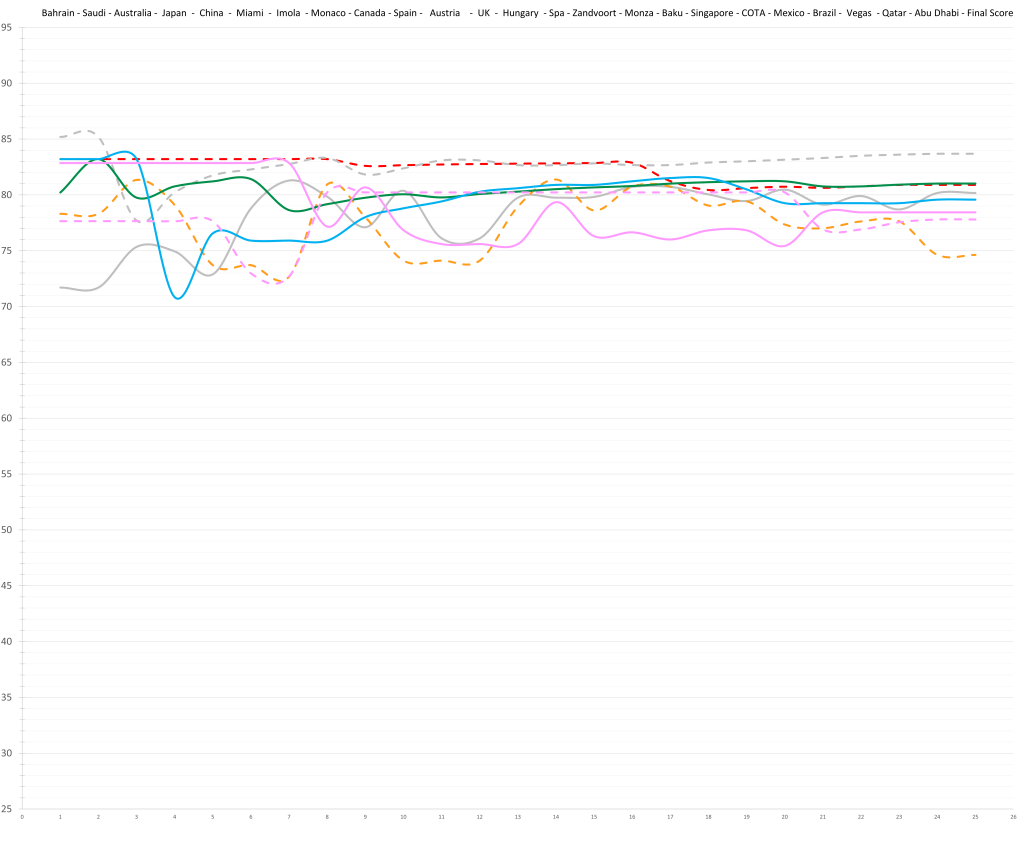
Season Ratings
Now that I have performance ratings (later referred to as ceiling/pace/potential) for the drivers, I can get a value for the car/team in a season since
(points)=(driver performance)+(car performance)
and therefore
(car performance)=(points)-(driver performance)
The driver errors are then added back in, giving a new points total, and through
(points)-(car performance)=(driver performance)
I get the actual performance of the drivers in that season. Those performance ratings are then translated back over the s-curve to give a “points per race rating” which goes from 0-10. That is then multiplied by 10 to get a neat driver score of 0-100.
As you can see, the major difference to the f1metrics model is the handling of driver errors. In my opinion this results in more accurate ratings as the amount of errors a driver makes can vary widely from season to season. Secondly, it has the advantage of untieing teammates in a season. A drivers rating won’t automatically get boosted just because his teammate is having a shocker.
At its core the model is assessing a drivers ability to score points with
(total points)=(possible points)-(lost points)
This can be abstracted onto the drivers. Simplified the drivers’ season ratings can then be understood as
(driver rating)=(driver pace)-(driver mistakes)
To help give some perspective for the ratings I made these tiers:
- S – above 89
- A – above 82
- B – above 73
- C – above 62
- D – above 50
- F – below 50
From going through all the data and seasons, I would say that generally a good season has a score above 73. Keep in mind, though, that there are no real cut lines. Another bit of context is that the median performance usually sits somewhere in the 60s. In 2021 it then jumped above 70 for the first time in 40 years, and has stayed in the 70s ever since.
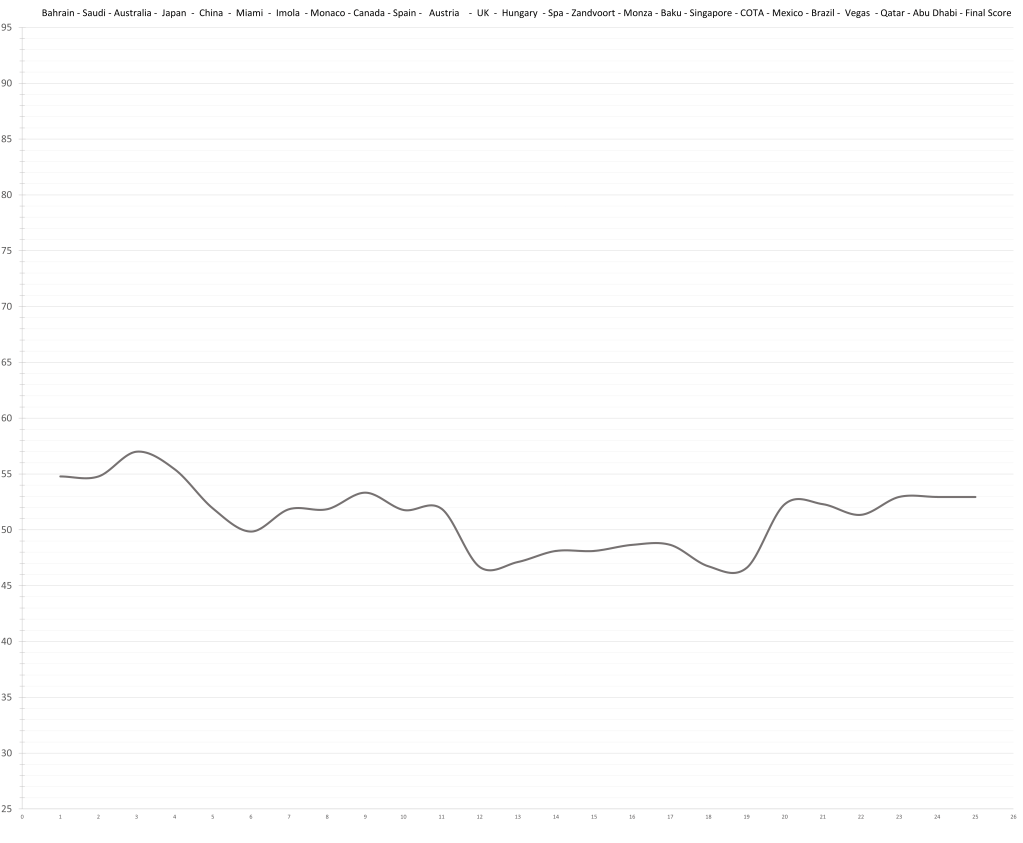
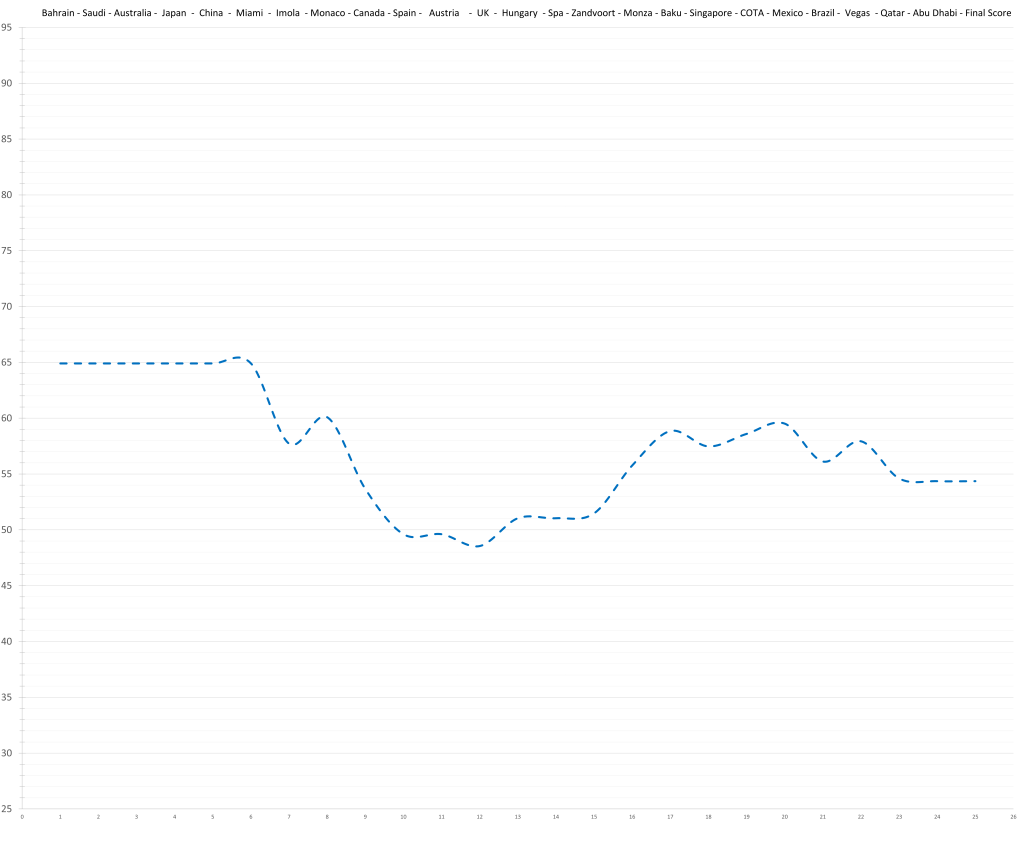
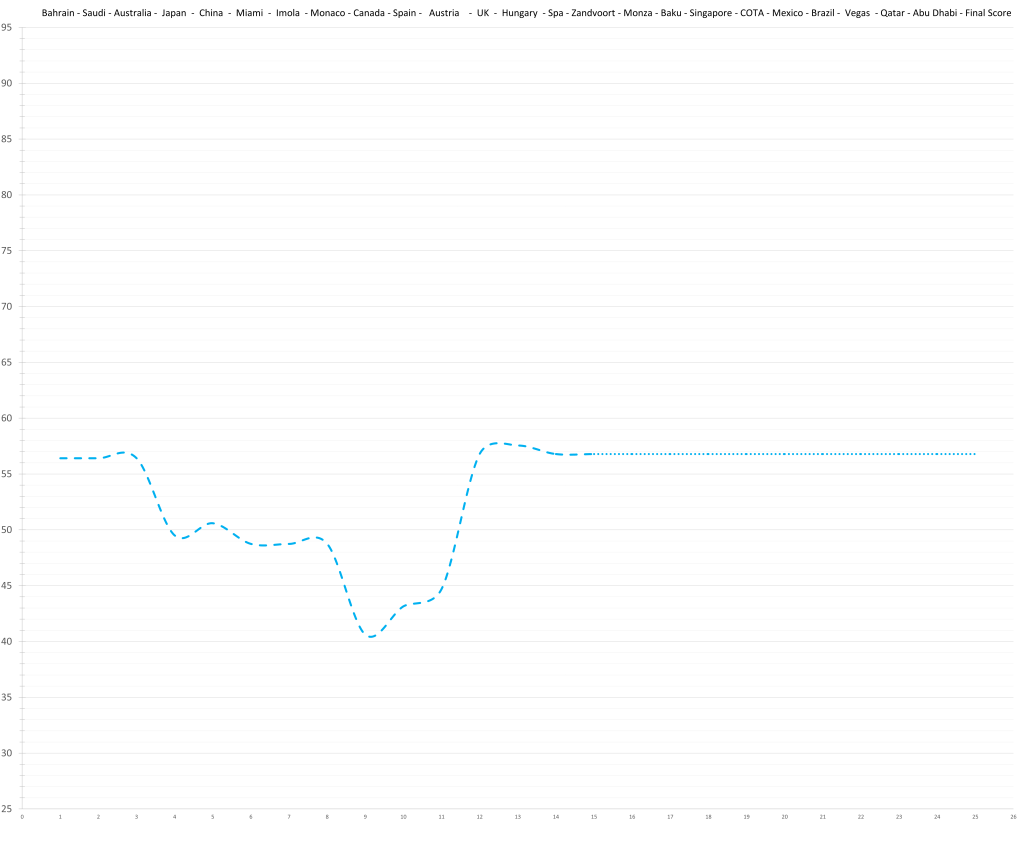
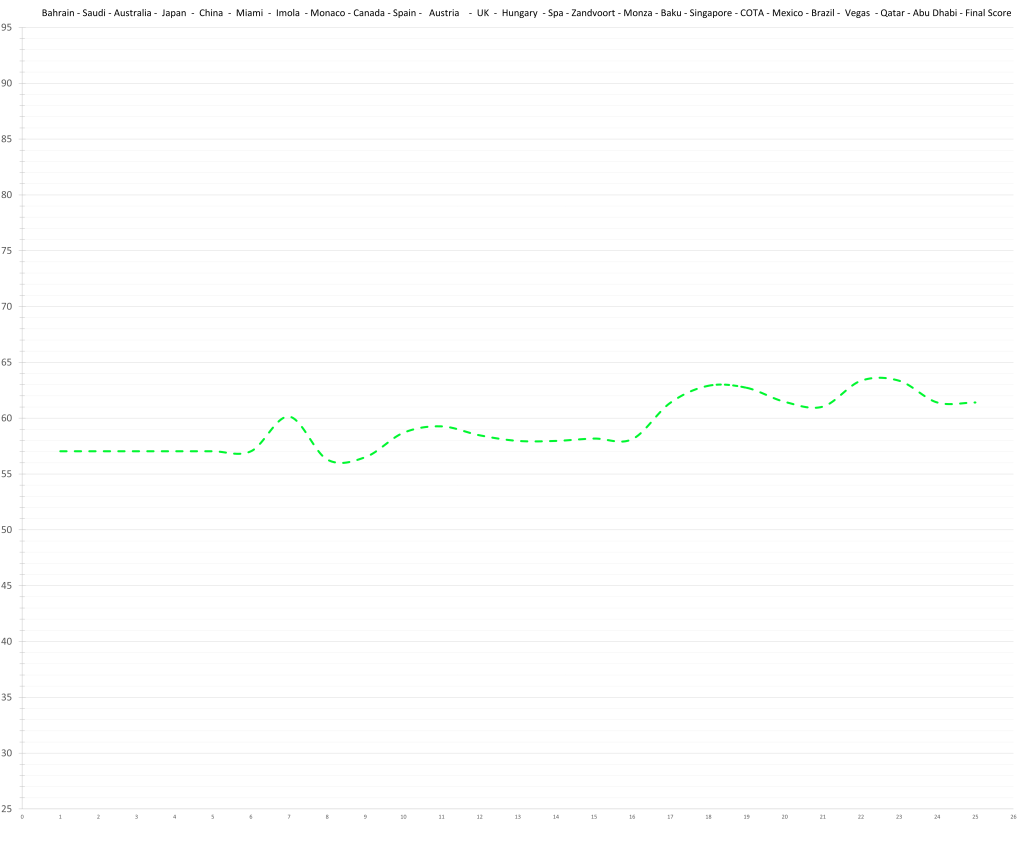
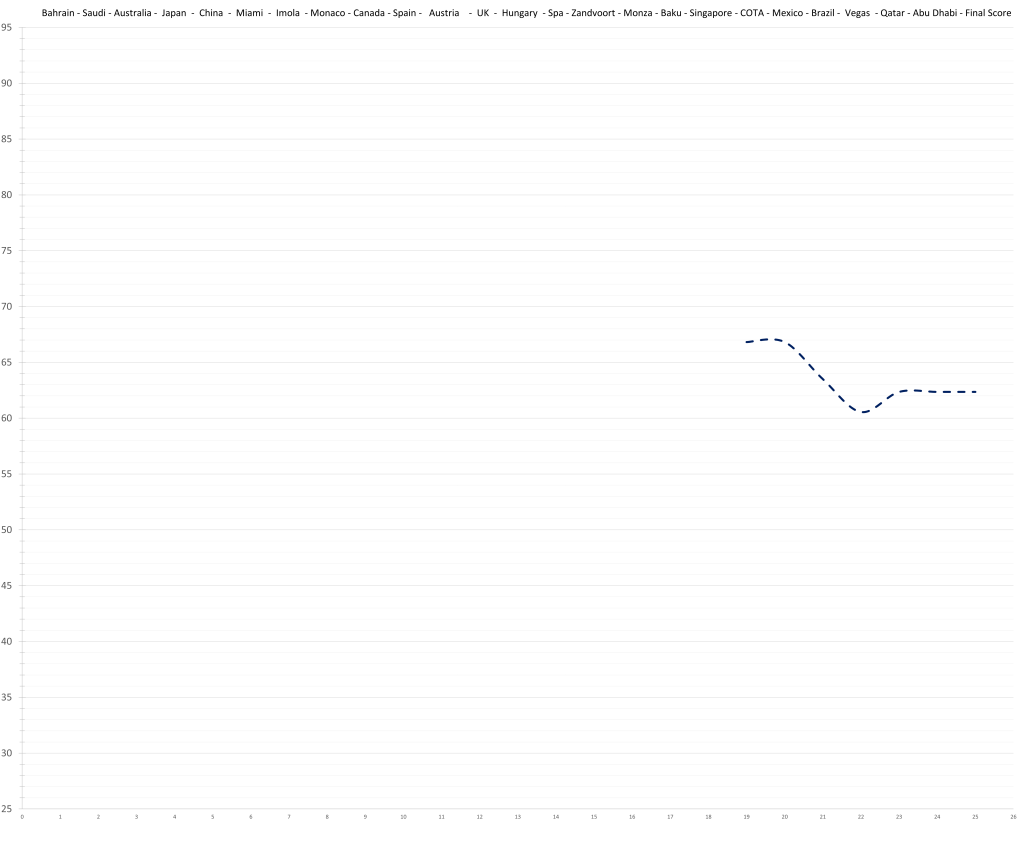
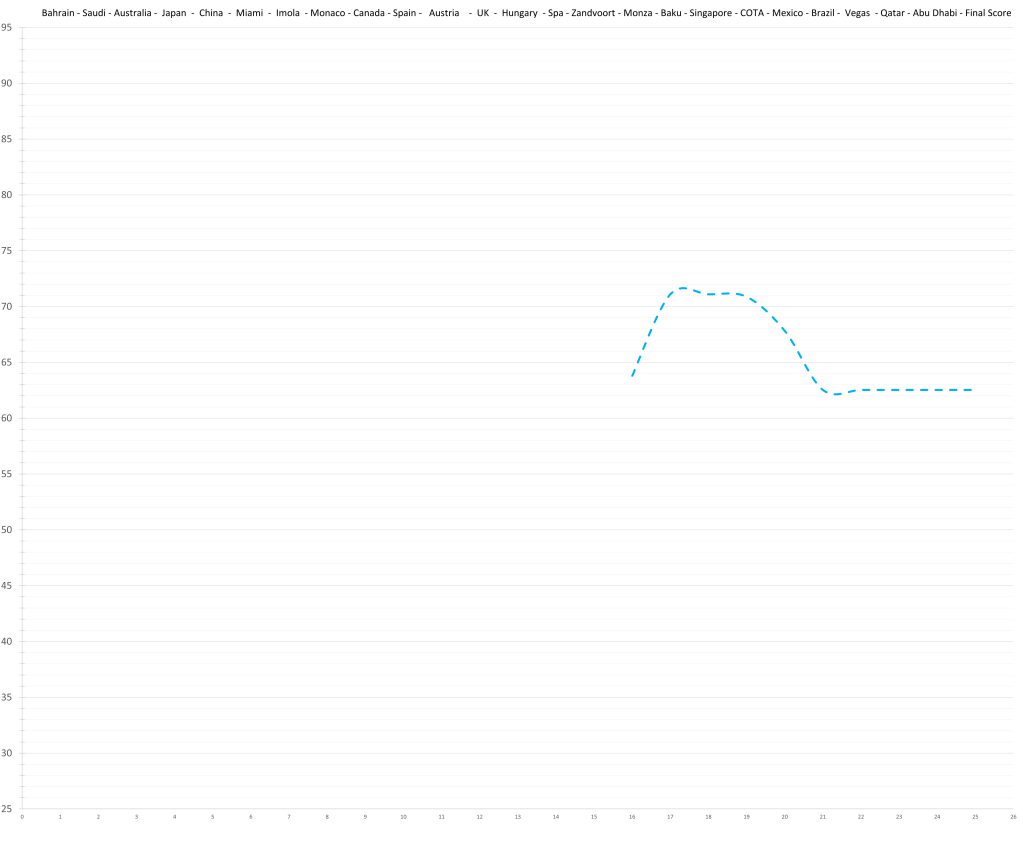
Each driver has their own entry including a graph documenting the change of their season rating through the races, a short summary and of course the actual rating. Behind the rating (in parentheses) you’ll find the drivers expected baseline rating for the 2024 season. It roughly equates to pace and can be understood as a ceiling (only for this season since this value moves with age and experience). It gives you a better understanding and context for the actual driver rating in terms of underperformance, mistakes, consistency, speed etc.
The “Should-Be-Gones”

22 – Kevin Magnussen – 52.9 (66.3)

If Kevin Magnussen hadn’t played jump rope with the penalty system, he would feel like an “also ran”. In the meantime, his teammate took the positive spotlight many times. The delta to Hulkenberg was far worse than it should be which could mean one of two things: Either Hulkenberg was pulling a career best performance out of nowhere, or (the default) Kevin – who is chronicly inconsistent – had a really bad season.
This being the lowest rating of any driver in 2024 also reinforces just how good the grid has become in its entirety. Not one driver is categorically not F1 material.
21 – Sergio Perez – 54.4 (71.1)
Better than Magnussen, better than Sargeant, what else does Sergio Perez have to do to finally get a seat in a top team?
20 – Logan Sargeant – 56.8 (66.3)

Based on his limited time in Formula 1, the model would predict that Logan Sargeant might have had a ceiling in the high 70s; although a relative lack of development is possible. This would actually be quite decent, but the reality is that no team wants to put resources and time into “quite decent”, especially not in the current hyper-competitive era. Especially, especially not, if he keeps maxing out the budget.
He actually has a similar ceiling to Yuki Tsunoda, and had the higher rated rookie season of the two (57 vs. 46) but where Yuki cut out most of his crashes and improved to 61 for his 2nd season, Sargeant stagnated at 57. While his pace increased, he actually became less consistent and more error prone. With the more promising Colapinto waiting, the decision was clear.
The next few seasons might actually change this estimate, since Albon’s data is slim and the Sainz team-up will make things clearer.
The “Mid-Pack”
19 – Lance Stroll – 61.1 (74.1)
Lance Stroll is not a great driver, but sometimes Lance Stroll is a pretty good driver. Most of the time, he is not. Most of the time that has little to do with pace at all. Sometimes he has a few races in a row, where he puts it together and looks decent. That’s when people say: “Alonso is taking it easy”.
18 – Zhou Guanyu – 61.4 (66.8)
Zhou Guanyu had an insane quali deficit to Bottas this year, but that doesn’t quite show up in the race results (10-7 in counting races). Partly, because Bottas leans towards qualifying, and partly because the Sauber was so abysmal, it didn’t really matter, so why try. The gap in the ratings between him and his teammate has been surprisingly stable throughout the season. Still, he did not meet the low expectations set by his previous seasons in terms of pace; although, to be fair, he did show up towards the end of the season when the Sauber stopped going backwards.
17 – Liam Lawson – 62.4 (66.8)

Another mid mill graduate, Liam Lawson is the latest in a long line of good but not great drivers coming out of the once revolutionary RBJT.
16 – Franco Colapinto – 62.5 (74.1)

Trying to reduce crashes by putting a rookie in the car is a cool strategy but apart from that, Franco Colapinto looks very promising. The very small amount of data so far suggests his ceiling lies above Albon’s.
15 – Daniel Ricciardo – 63.0 (79.4)
Although the team officially couldn’t find any faults in Daniel Ricciardo’s old chassis, since the change the delta fits expectations while Ricciardo was underperforming before the change. It might just be a timing coincidence or psychological, though.
In general, the model would suggest the narrative of Ricciardo’s downfall to be exaggerated. Part of this comes down to Daniel being overrated in the public eye. According to the model, he was never expected to beat Norris in the first place. That is not to say that he hasn’t performed worse since 2021, but he didn’t outright lose pace, just consistency which might even be explained by a shattered confidence. Maybe Ricciardo kept trying to change things because he wasn’t beating Lando, when he really was performing at his best, and “didn’t notice” due to Norris being in his view (and that of those surrounding him) surprisingly still quicker, resulting in some shockingly bad races every now and then.
14 – Valtteri Bottas – 63.1 (72.1)

Valtteri Bottas was dominating his teammate in qualifying, and most of the time, he got everything he could out of the car. That is very similar to Hulkenberg, yet he doesn’t get close to the same recognition because the car team is awful.
13 – Nico Hulkenberg – 65.2 (70.6)

Nico Hulkenberg dominated Magnussen far beyond expectations. While it is tempting to fully ascribe this to Hulkenberg, realisticly Magnussen just had a really bad year and the Haas was leading the midfield on balance. According to the model, Max Verstappen would have scored more points in a Haas than Sergio Perez did in the Red Bull.
12 – Yuki Tsunoda – 70.4 (75.0)

Yuki Tsunoda has made some big steps over the last two seasons. There is the assumed increase in pace through age and experience, but there is also a different maturity. 2023 and especially 2024 have seen Tsunoda become a lot more reliable and consistent. The data on Yuki is still relatively slim, however the model would expect him to be close to Ricciardo in 2024. He started the season dominating the Australian but after Daniel had the chassis change, the delta seems to comply with expectations.
The “Good Ones”
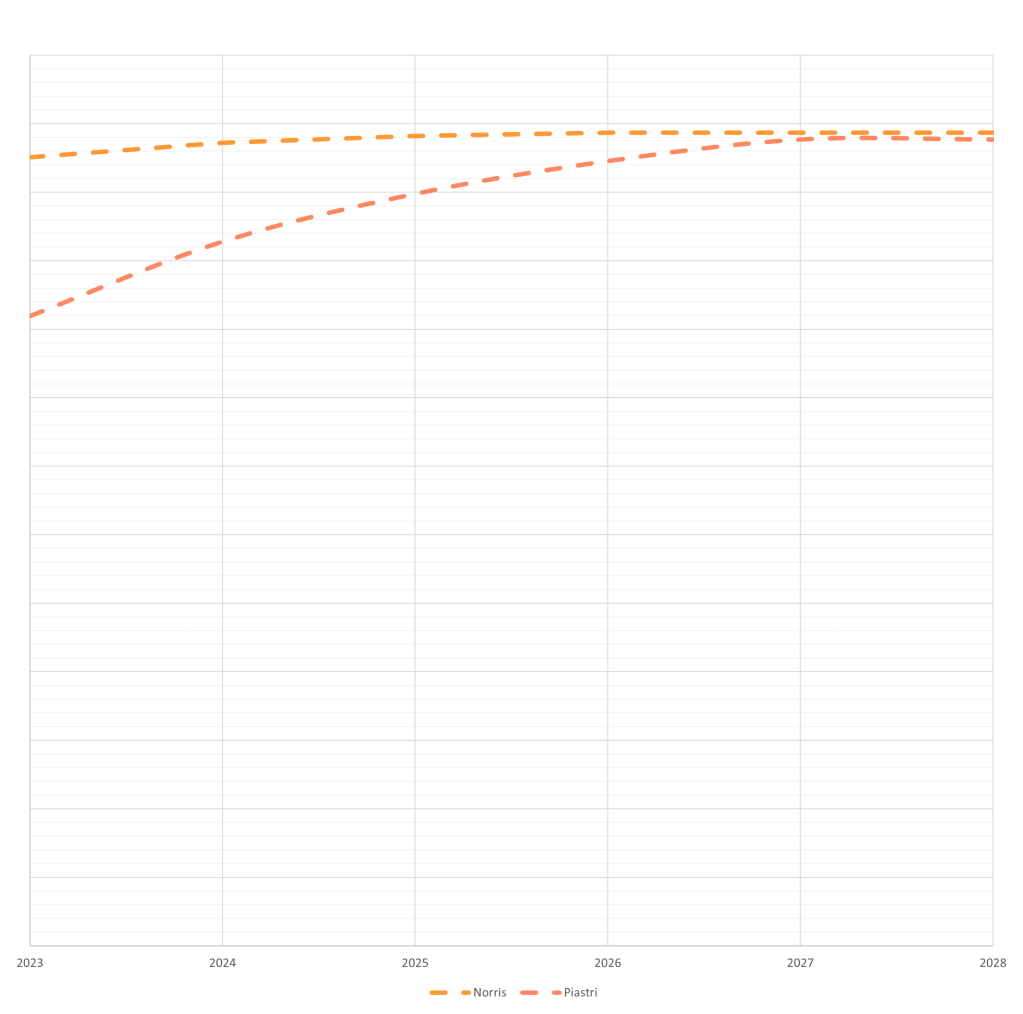
11 – Oscar Piastri – 74.6 (81.4)
While he has proved that he can be an amazing wheel to wheel driver, Oscar Piastri’s delta to Lando Norris was bigger than expected throughout the season. Now that 2024 is done, his ceiling has been adjusted slightly downwards, suggesting he won’t ever eclipse Lando on pure pace.

10 – Pierre Gasly – 77.8 (80.2)
Pierre Gasly’s season was incredibly consistent with virtually no mistakes. Unfortunately, his only little wobbler turned out to be costly, because he finished behind Ocon in Brazil where Alpine scored a double podium, while they barely made it to the points before that. Unfortunately, this probably underrates Gasly’s season a bit.
It might also be important to note that both Alpine drivers claimed to be disadvantaged at various points of the season, perhaps completely invalidating the whole comparison.
9 – Esteban Ocon – 78.4 (81.4)

Before the summer break, Ocon was the slightly faster Alpine driver. Since then, he fell off; often struggeling a lot more than Gasly with the car. Either psychologically for Ocon, or in the actual work of the team, his upcoming departure probably had some amount of influence on this trend.
His rating is lifted above Pierre’s eventually by a brilliant performance at the Brazilian GP, and the immens weight of a podium amongst 10th and 11th place finishes.
8 – Alexander Albon – 79.6 (83.2)
Alex Albon is still doing well and still based on pretty slim data. The latter will hopefully change next year. The Sainz pairing is a very welcomed piece of the puzzle. Currently, Albon and Sainz should be dead even on pace, with Carlos likely being the more well rounded driver overall.
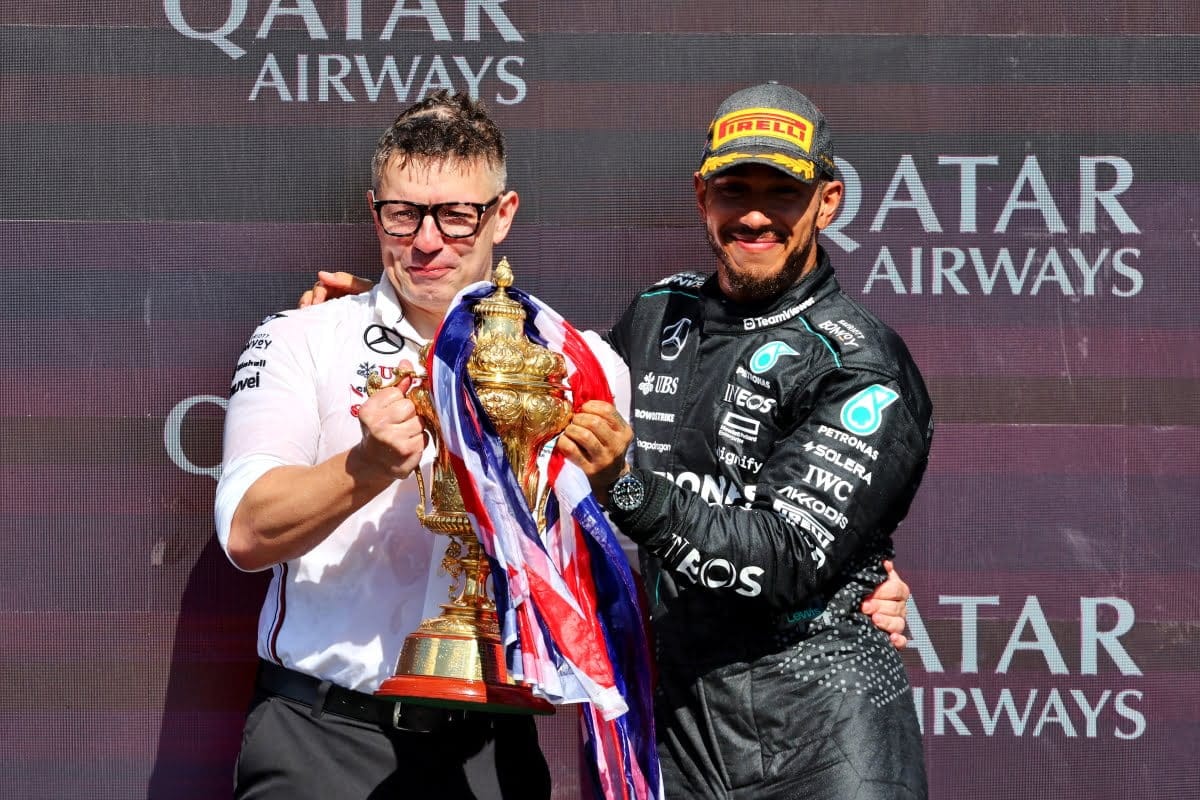
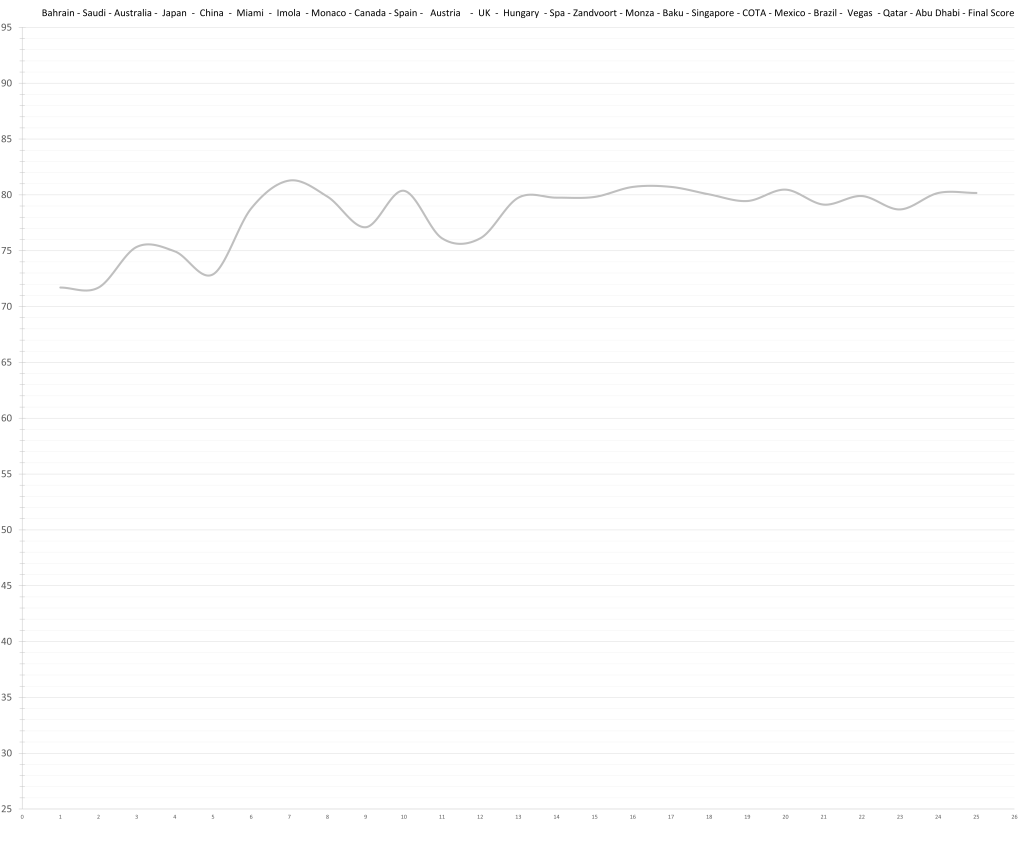
7 – Lewis Hamilton – 80.2 (85.8)
Before the summer break it looked like Lewis Hamilton had picked up some momentum and would start to level with Russell. However, that up-tick in form seems to have been a false dawn. He went back to mostly trailing Russell (often due to poor qualifying). By the model’s estimate, the pair should have been equal on pace, and based on 2023 one would expect Hamilton to come out ahead overall due to being the more reliable scorer. This turned out to not be true, as it was Hamilton this time around, who committed more blunders. 2024 has been Hamilton’s lowest rated season in years; arguably his worst since 2011. Rather remarkably, it’s not really poor in an absolute sense at all, but this year’s grid performed exceptionally well. Even in 2023, he would be ranked 6th, ahead of Russell.
What does this mean for next year? Honestly, not much. Since most of his 2024 deficit is due to mistakes, unrelated to his natural decline, the expectation can be for him to bounce back to “normal” in 2025. However, he will continue to decline, turning 40 before the season. The expected delta to Leclerc is similar to that of Rosberg to Hamilton in their prime. Maybe he can rosberg Leclerc if the Ferrari is dominant (it could happen, theoretically). Other than that, it would be very surprising if he beat Leclerc over a season.
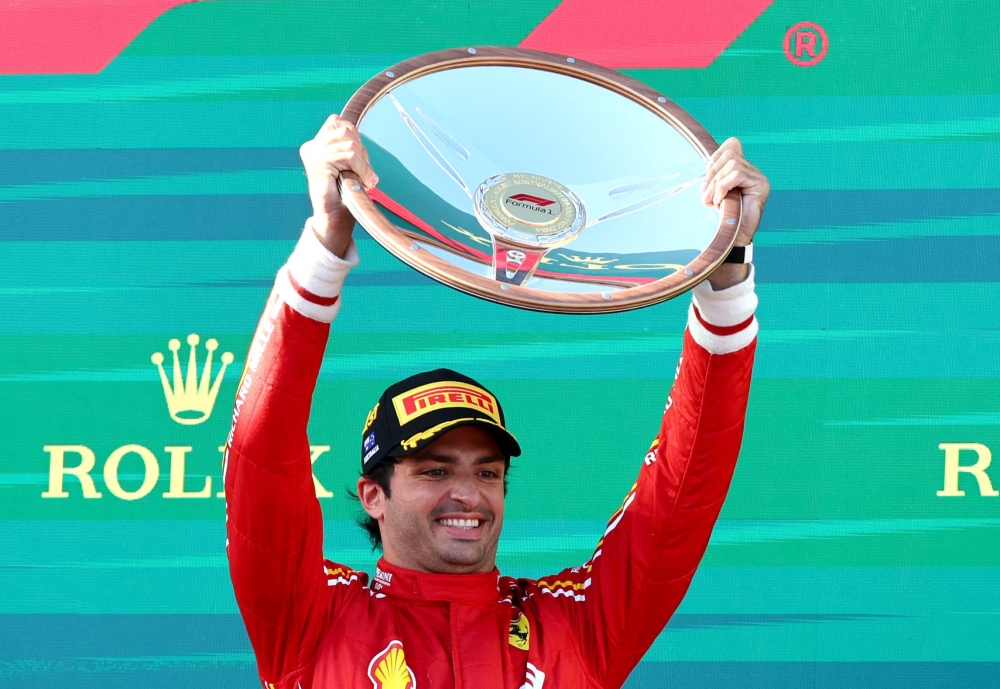
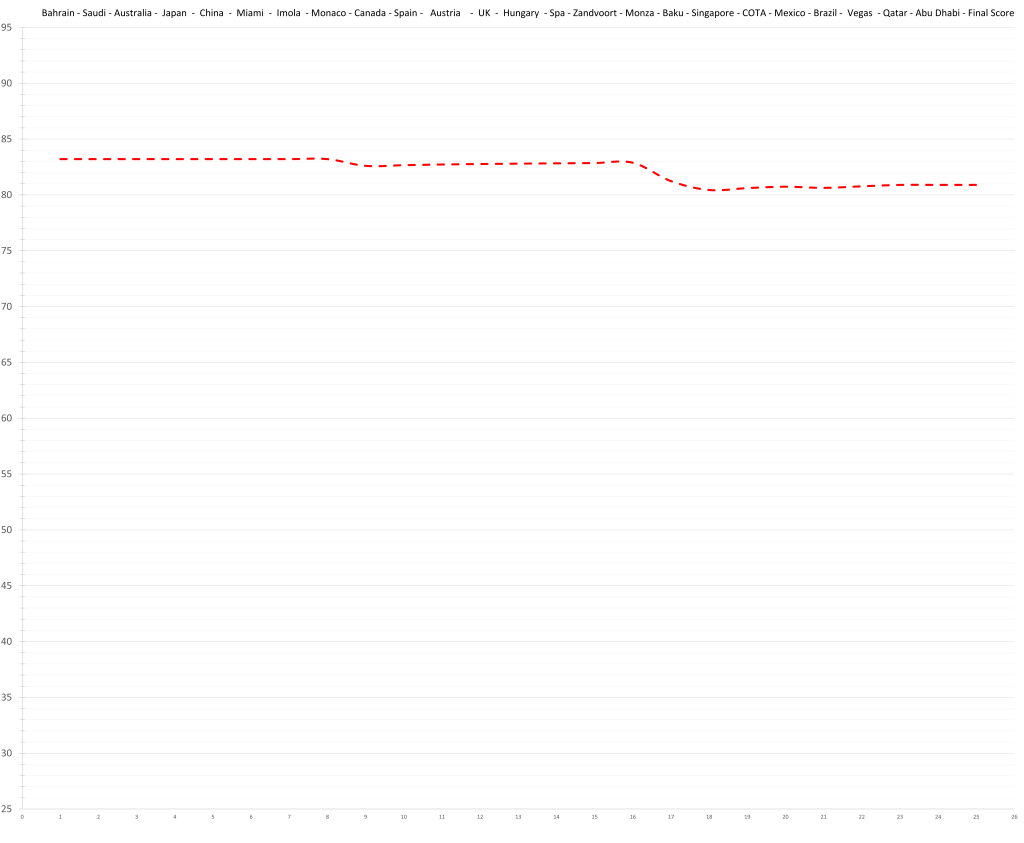
6 – Carlos Sainz – 80.9 (83.2)
Carlos Sainz finally had a Sainz-season again; first time since 2021. Consistency used to be one of his trademarks, especially between 2019 and 2021.
Additionally, Sainz’ ceiling has recieved a small upgrade from Button level to Rosberg level.
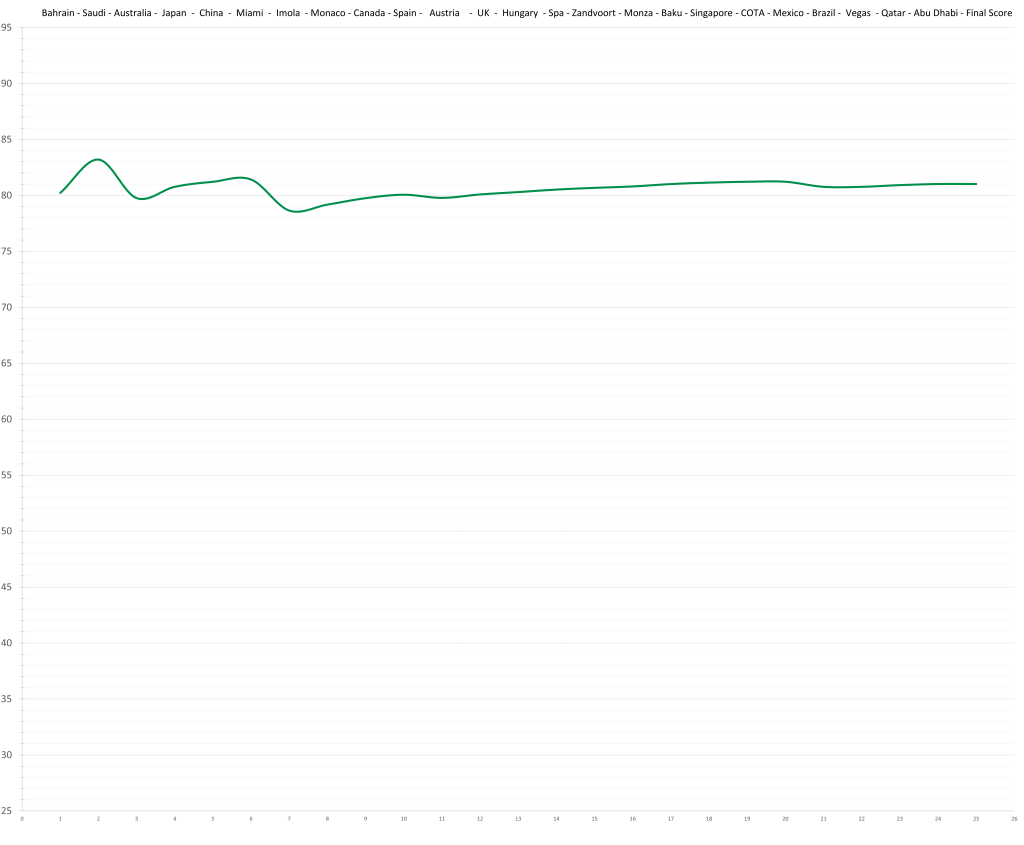
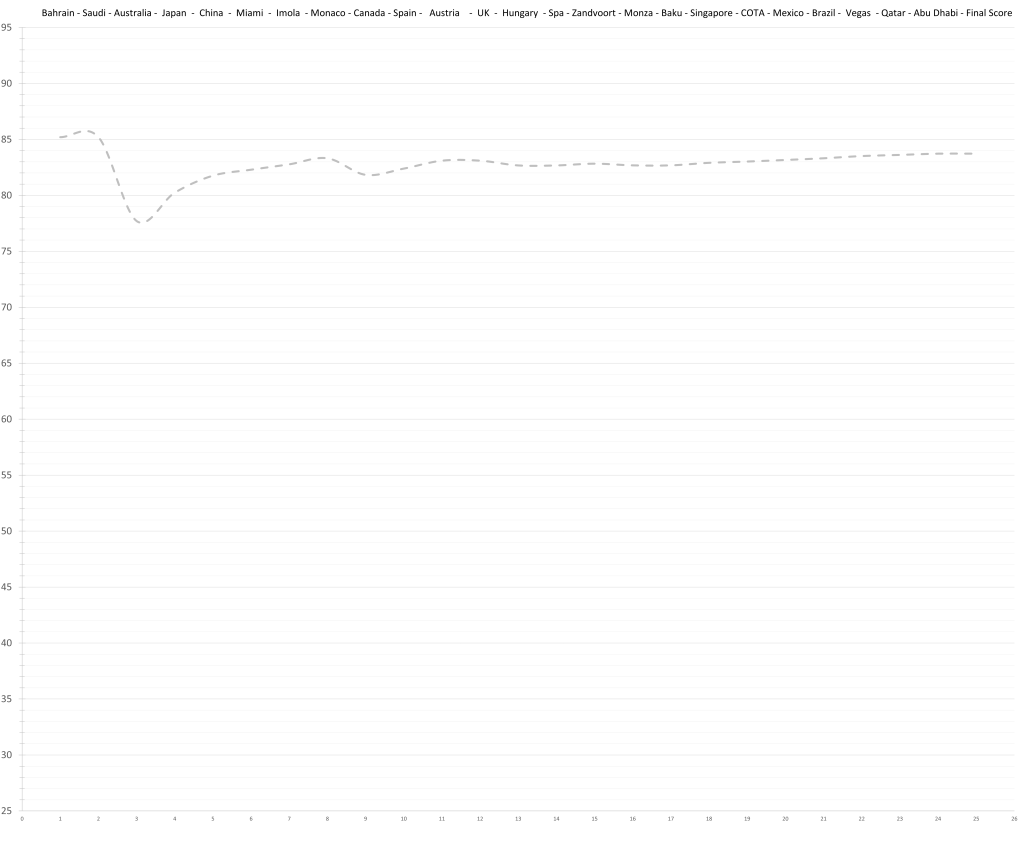
5 – Fernando Alonso – 81.0 (83.2)
Age is not even stopping for Fernando Alonso. He is still a very capable driver but it won’t be too long, before Alonso will drift into mediocrity. It’s harder to notice year to year but at some point he will noticiably not be a top driver anymore and a lot of people will pretend it happened over night. Some already say he’s not there anymore, while last year he was one of the best, when most of that perception is down to car performance.
4 – George Russell – 83.7 (85.2)

George Russell had a personal best season. This is obvious with and without a data driven approach. He seemed quicker than Hamilton at most weekends but also to have grown more mature and patient. There have been some moments of overeagerness but his step up from 2023 is still quite noticeable.
The “Top of the line”
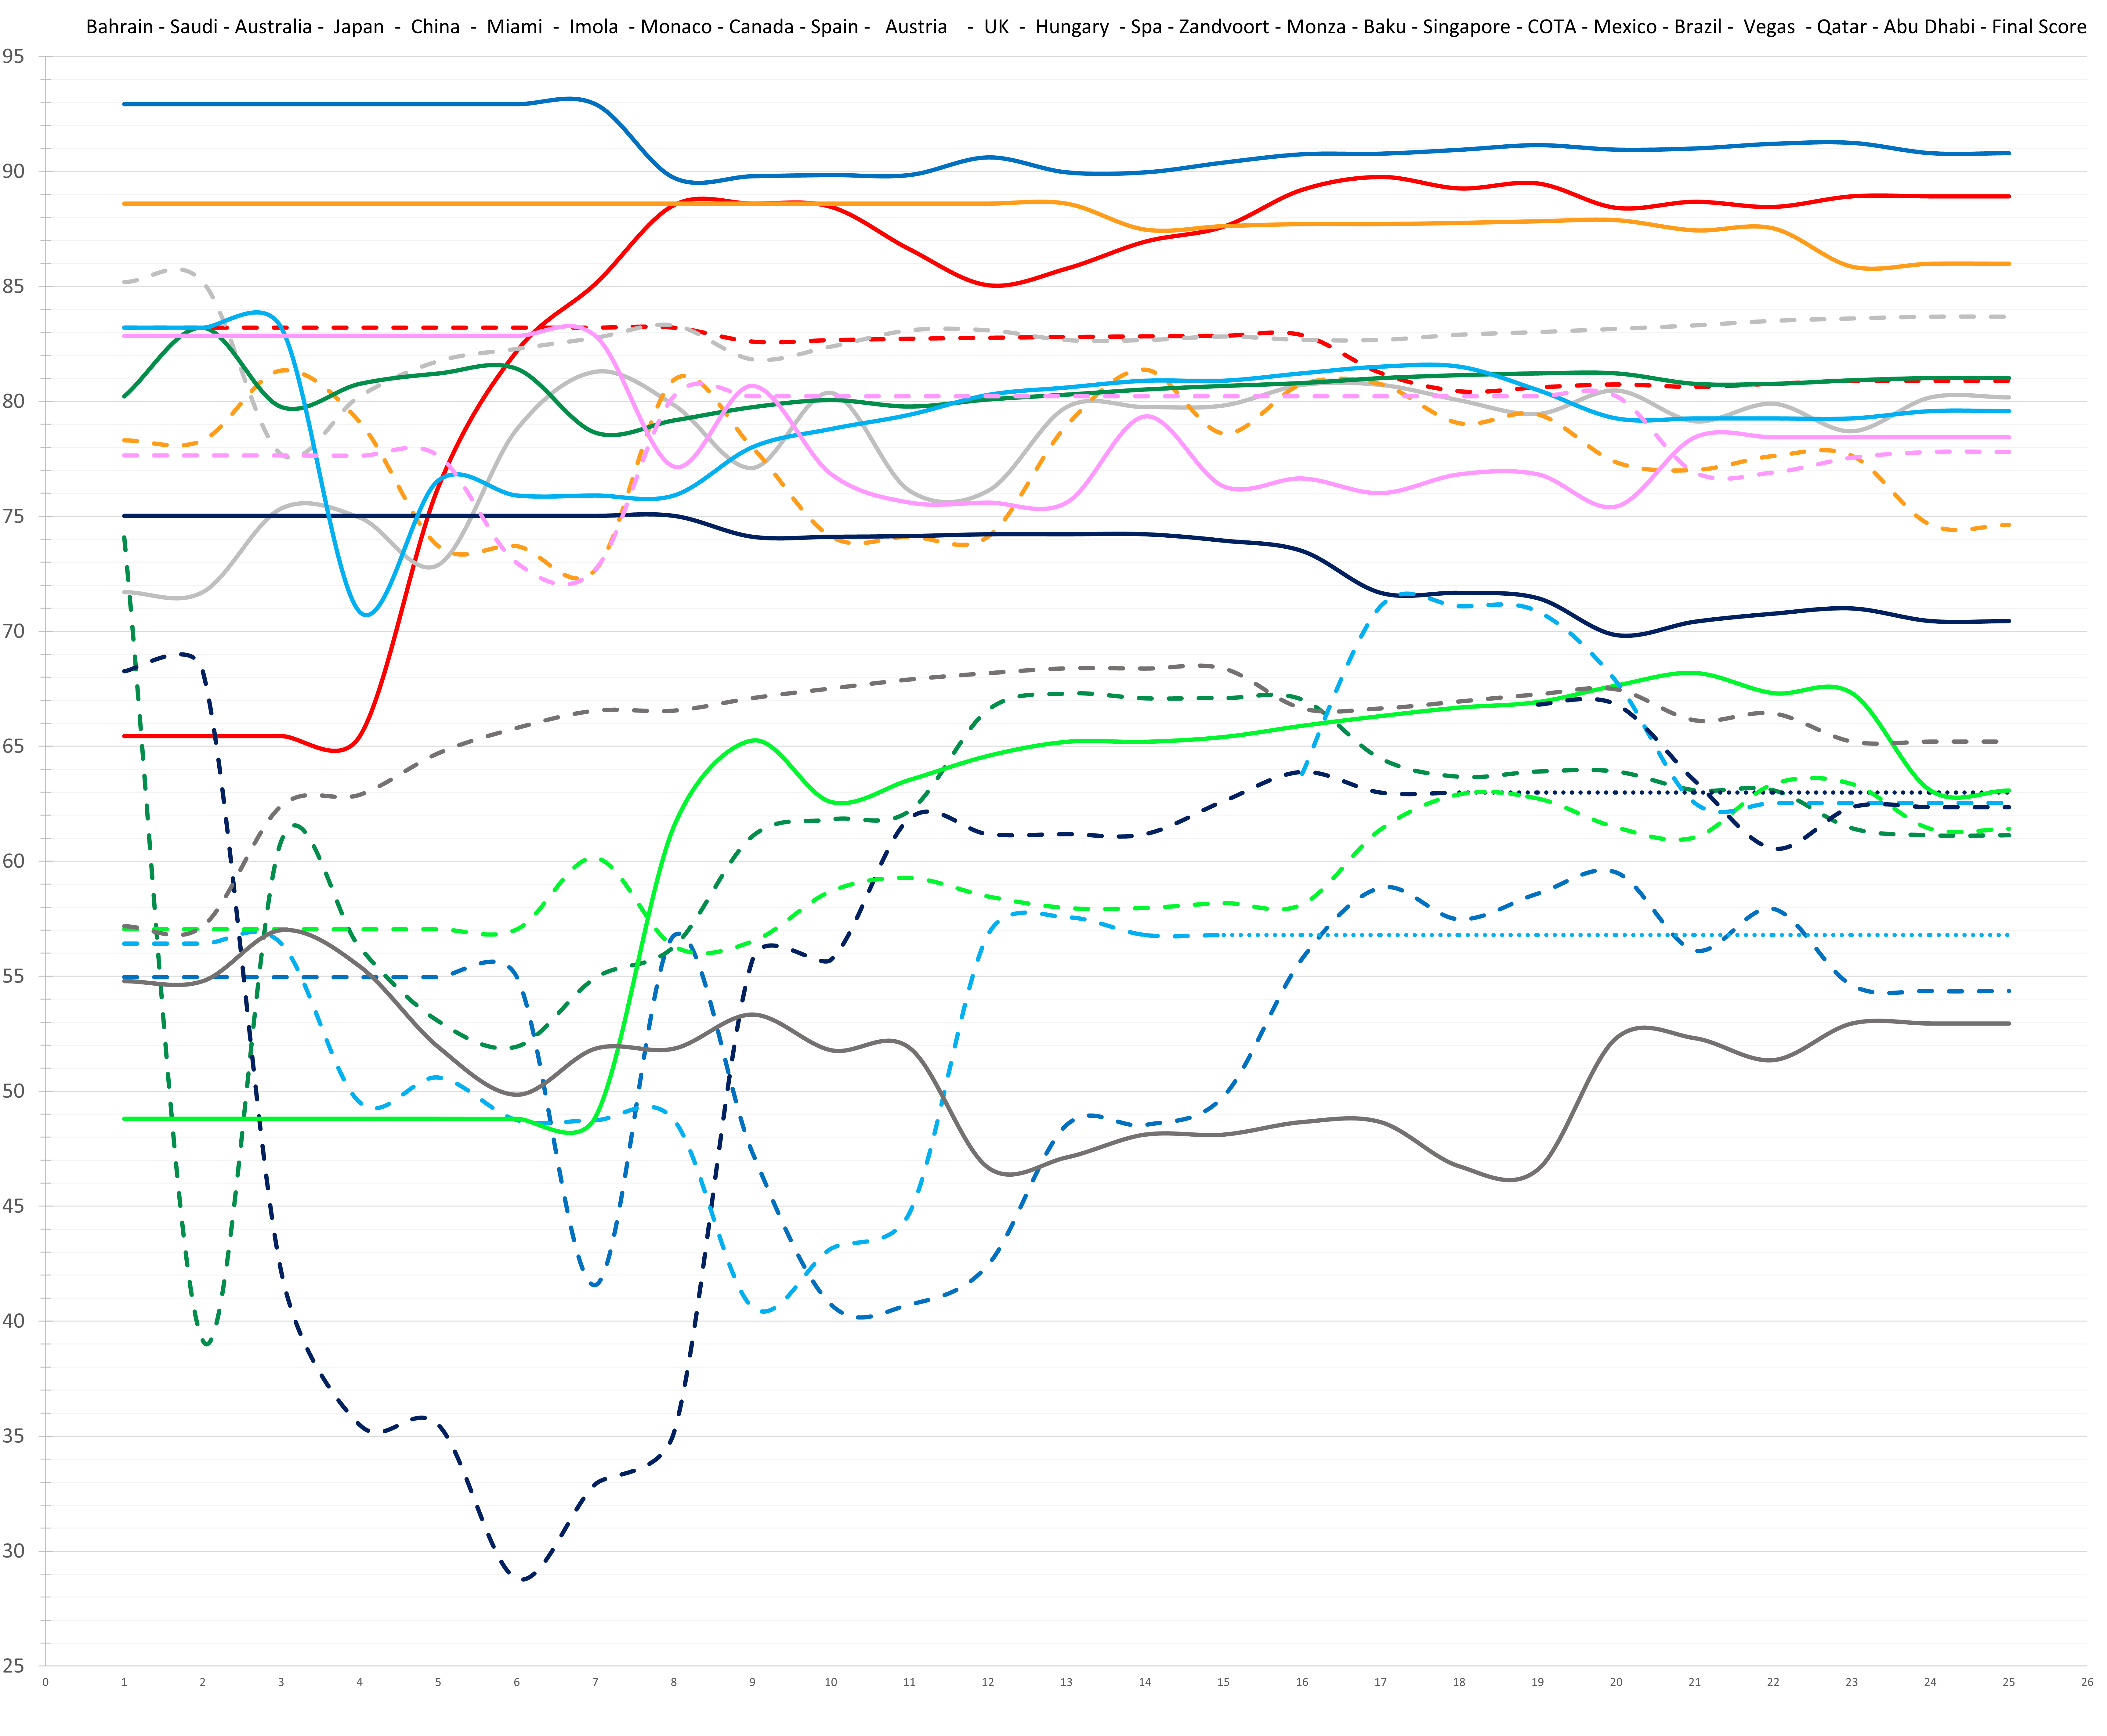
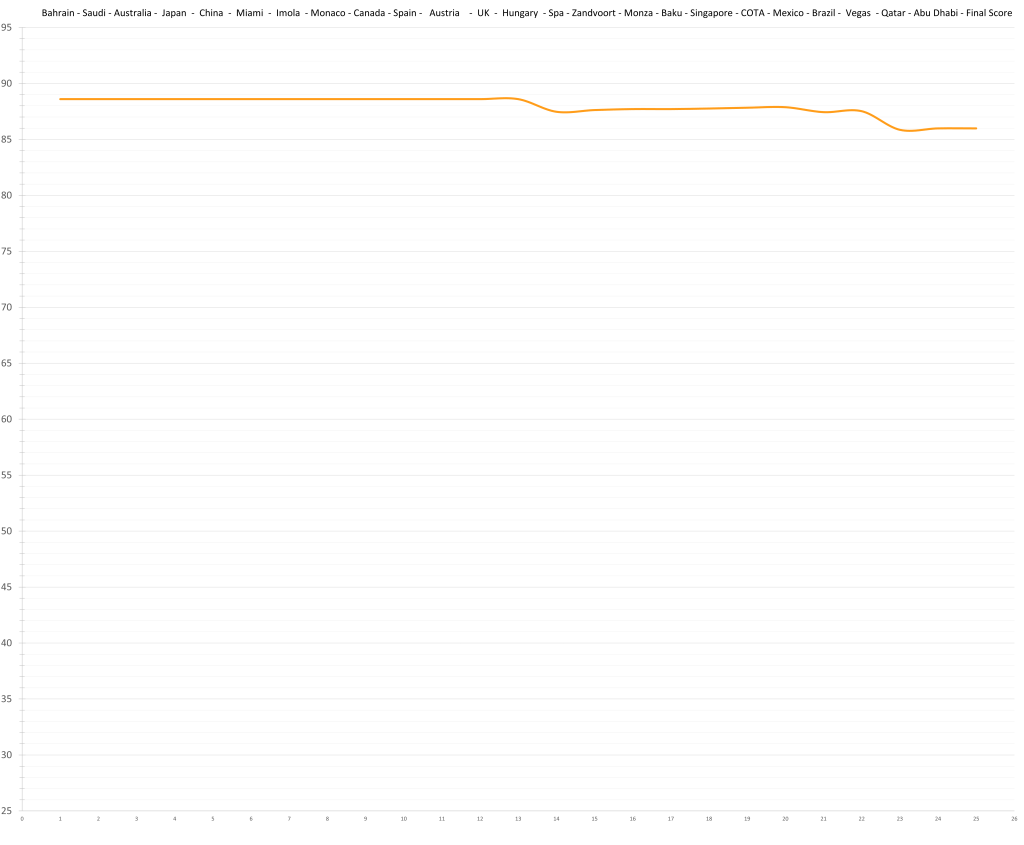
3 – Lando Norris – 86.0 (88.6)
Lando Norris couldn’t quite keep up with Max Verstappen. Then again, who can?
Throughout the season Norris was criticised for making to many mistakes or at least not winning when he had the fastest car. As far as the model goes, there is no evidence for this. If there were something to those accusations, it would be visible in the delta. Not only is that not the case, the delta was actually slightly bigger than expected resulting in Piastri’s ceiling dropping. So what causes the mentioned impression?
A) The simplest explaination would be Piastri being a far worse driver than is currently estimated. This would resolve itself with more data.
B) Maybe the drivers are correctly rated (relative to each other). What became increasingly clear is that the McLaren was only far ahead on low fuel resulting in great qualifying and late race performances, and unfortunately what stuck with people is the impression that Lando couldn’t hold on to his poles and came second with a clearly faster car. Over the whole race distance, McLaren wasn’t exactly dominant. The best example is Austria. Verstappen controlled the race until a poor pitstop put him in Norris’ range late in the race. Only at this point was the McLaren actually faster and Norris could get to Verstappen and try to overtake him. This was basically the pattern from Miami to the summer break.
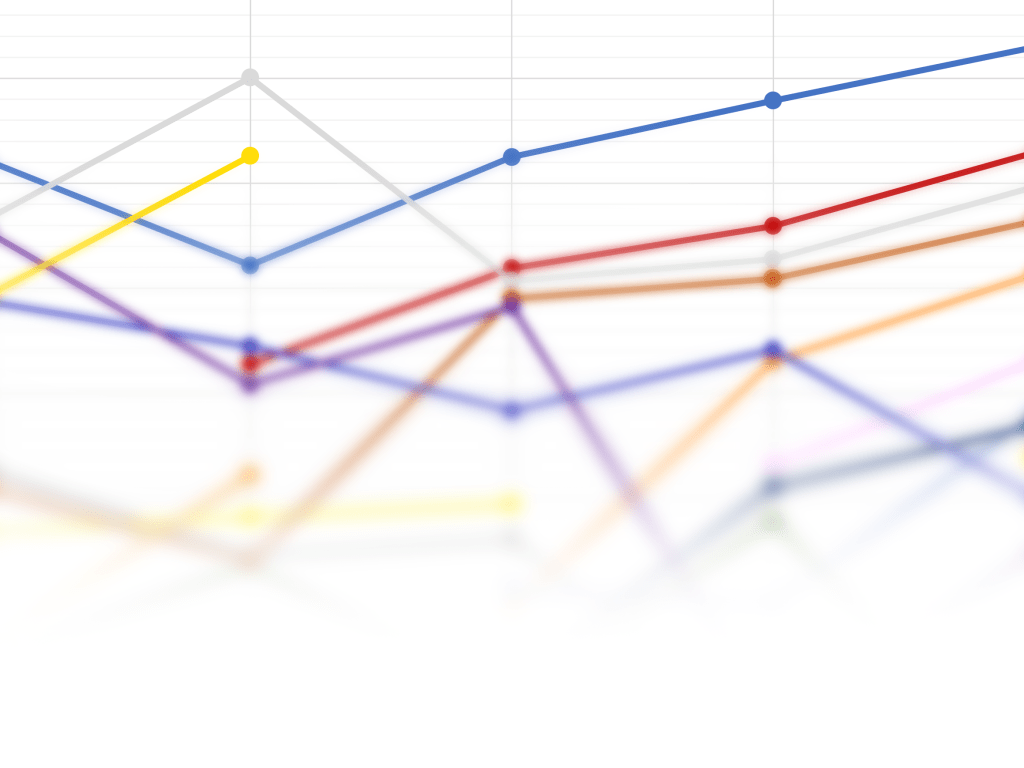
Concerning the poor starts, I noted the following (cleaned) stats for places gained and lost by Norris and Piastri at race starts.
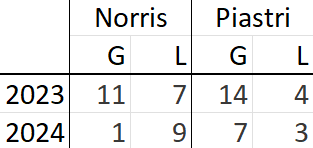
Two things are immediatley obvious: While a small part of the difference likely comes from Norris starting ahead of Piastri most of the time, Piastri is a better starter than Norris is. They also gained far fewer positions in 2024 than in 2023 which can be attributed to simply starting higher up the grid. Looking at the loss numbers, they are roughly the same in both years. This suggests that Norris did not actually crumble. He can still work on this to become better, but the notion that he choked under pressure seems somewhat absurd. In previous seasons, Lando’s start stats were 7/13 (2022), 3/11 (2021), 9/9 (2020, shortened season), and 13/12 (2019). In spite of a slight upward trajectory, it seems like Norris has been an inherently poor starter from the beginning. This means it is part of his current potential, hopefully alleviating fears of him being overrated in 2024.
While he isn’t quite Max Verstappen (far from it even, as he is almost as far behind Verstappen on pace, as Piastri was behind him according to the model), he is still an incredibly good driver, and to dispute him being championship material is preposterous. His 2024 was better than what many actual champions have ever reached.
2 – Charles Leclerc – 88.9 (92.1)

Charles Leclerc had his best season so far in 2024. With this, he moves into the model’s top 10 drivers (1969-2024), replacing Alain Prost. For comparison, Verstappen moved ahead of Prost in 2021, and Hamilton after 2014.
He still hasn’t really managed to come close to fulfilling his potential completely by delivering a perfect season. While he is not really crash prone, he regularly loses points in, for example, changeable conditions by making wrong decisions. Purely driving wise, Leclerc is practically equal to Verstappen, but he hasn’t been able to maximize points in every area. That includes the aforementioned decision making, but also perhaps communication, and knowing exactly where and how much the rules can be used in your favour.

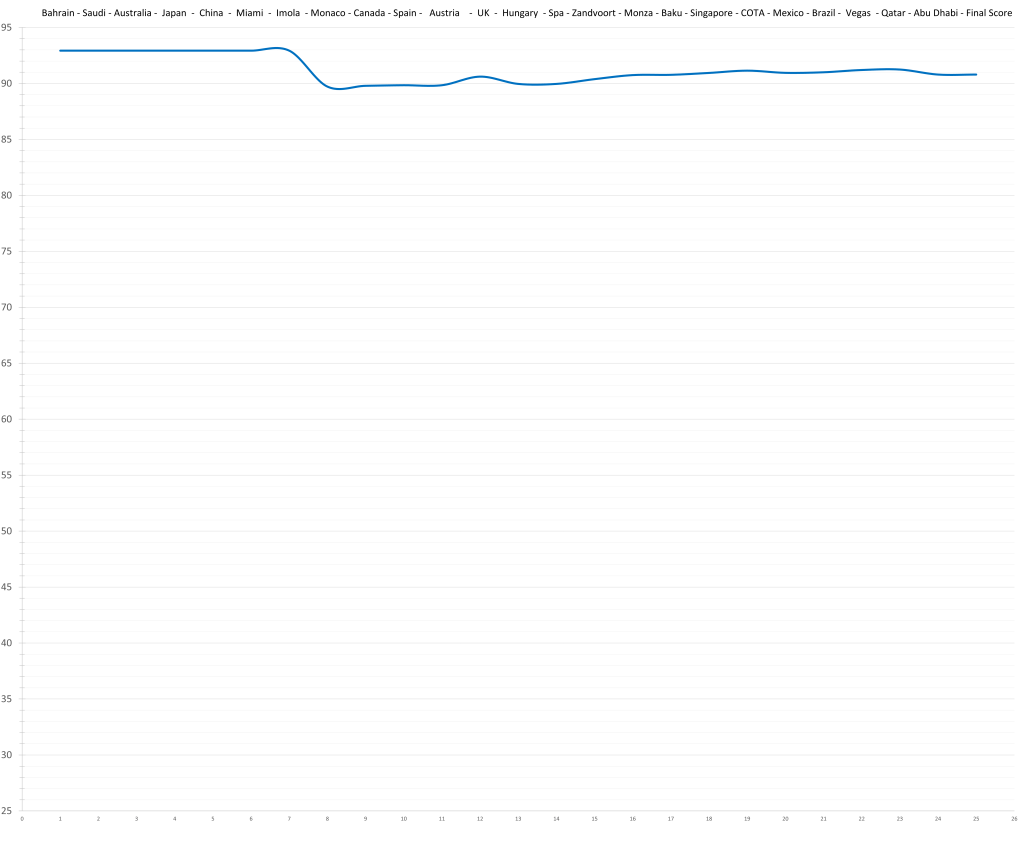
1 – Max Verstappen – 90.8 (92.9)
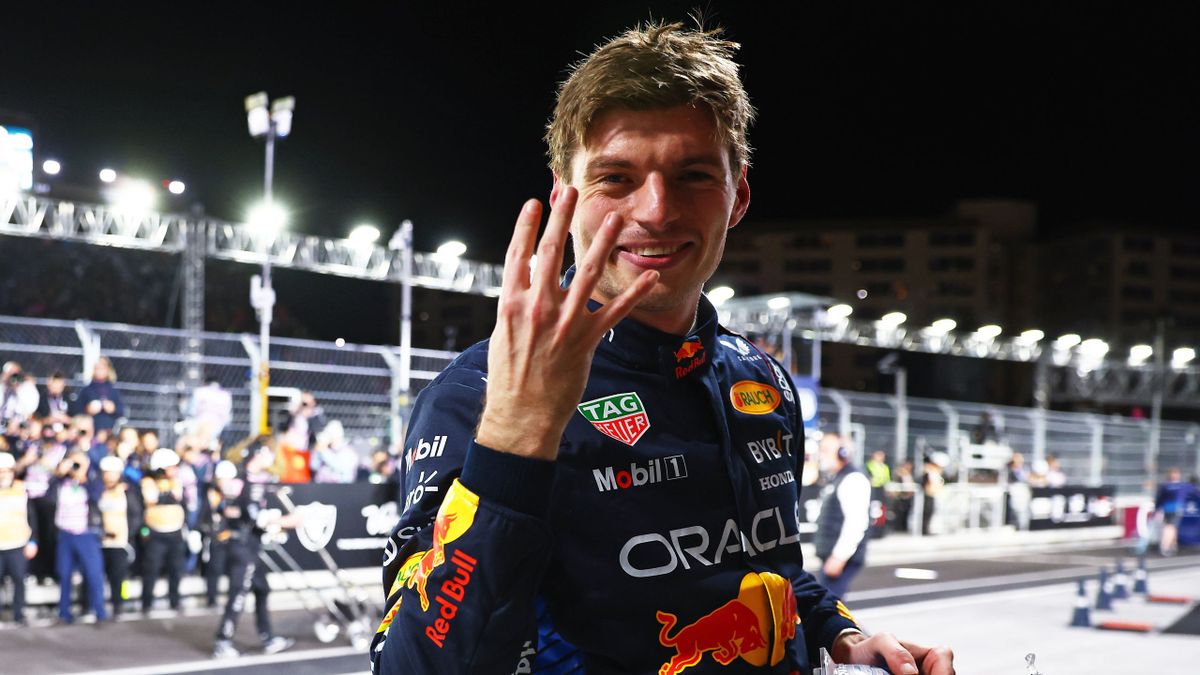
Still number 1, but Max Verstappen was finally put under pressure again and proved that he is not only quicker than the others, but also much better than his peers at using everything he can to his advantage. Pretty early on when it became clear that McLaren were going to be better than Red Bull, he switched to a Norris focused approach, concentrating not on maximizing his points, but instead on points relative to Norris; he also used every inch of the rule book and then some in his favour.
The model does not rate McLaren higher than Red Bull but it confirms the general feeling that Max would have won the WDC at McLaren nonetheless; although possibly a weekend later. However, Max’s (alcoholized) claim, he would have won it even in the Ferrari holds no truth according to the model. While he could have challenged Lando, Leclerc in the RB (in a straight swap scenario) is projected to ultimately win it from Norris, with Verstappen likely a close 3rd.
Verstappen took his 6th “title” in a row from the model, equaling Alonso’s streak from 2008 to 2013. On the other hand, not even Max will probably come close to Schumacher’s 12 in a row, 10 of which unchallenged; his competition should be too strong for that. In the model’s all-time-but-really-just-from-1969-onwards-list Verstappen (3rd) is now within striking distance of Senna (2nd).
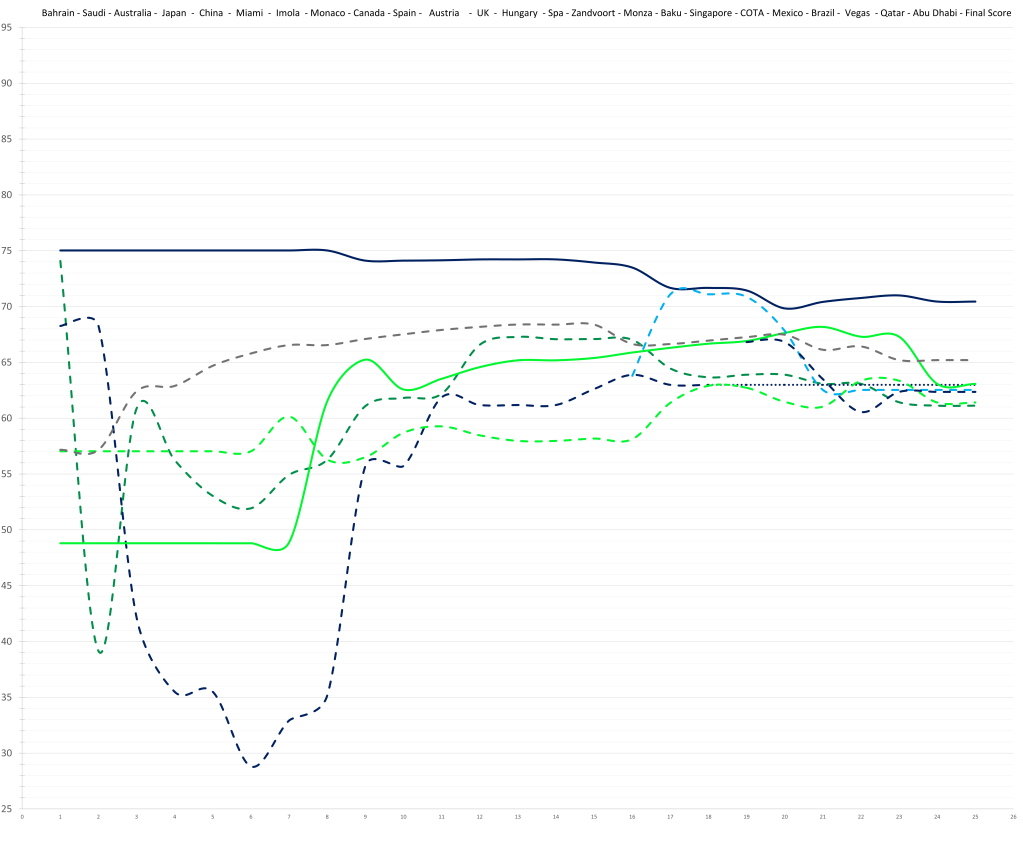
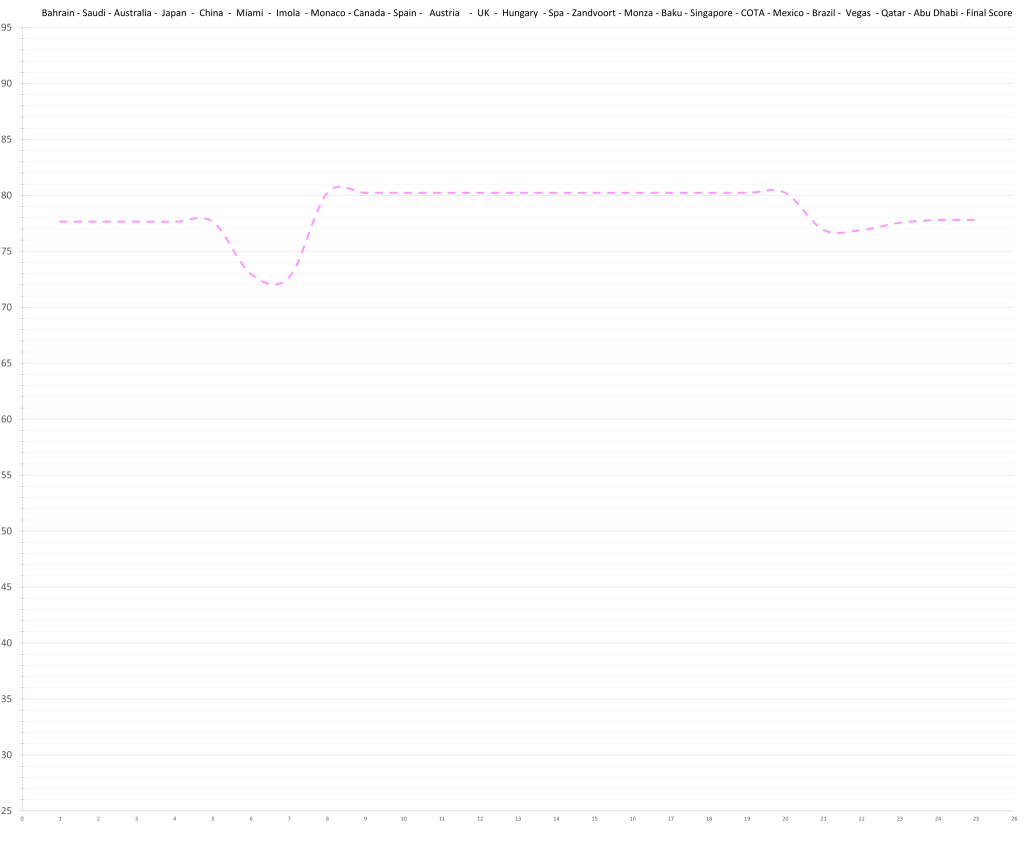
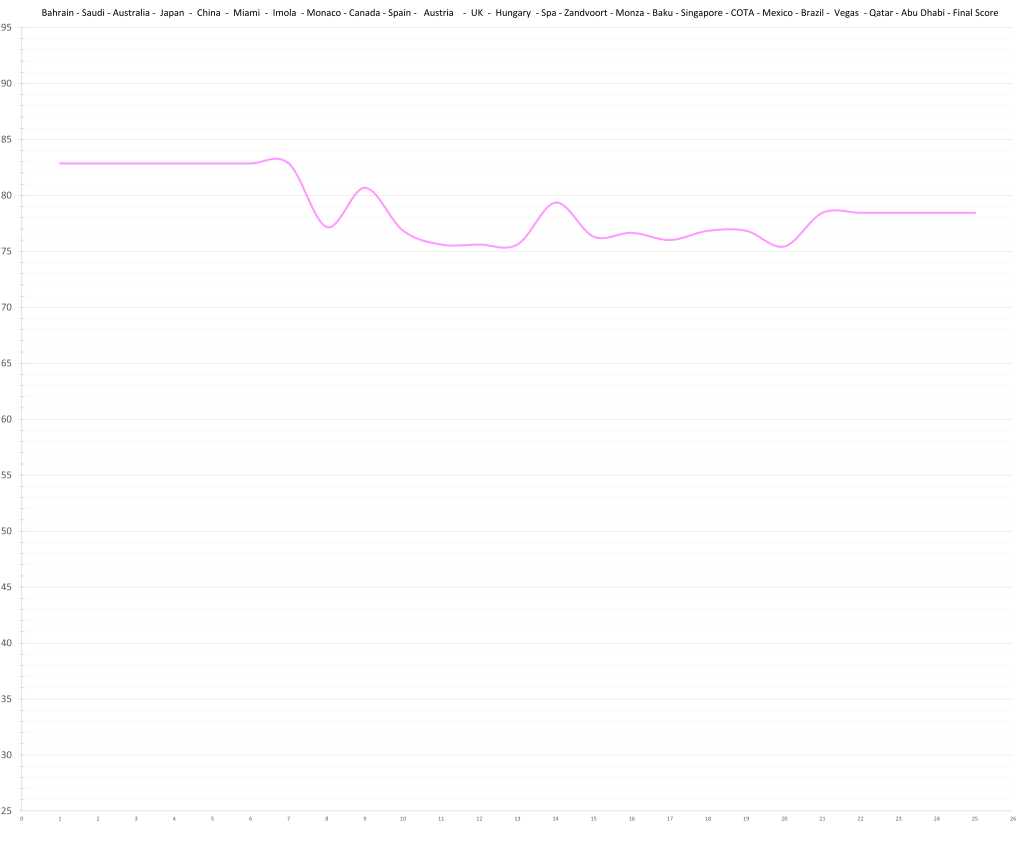
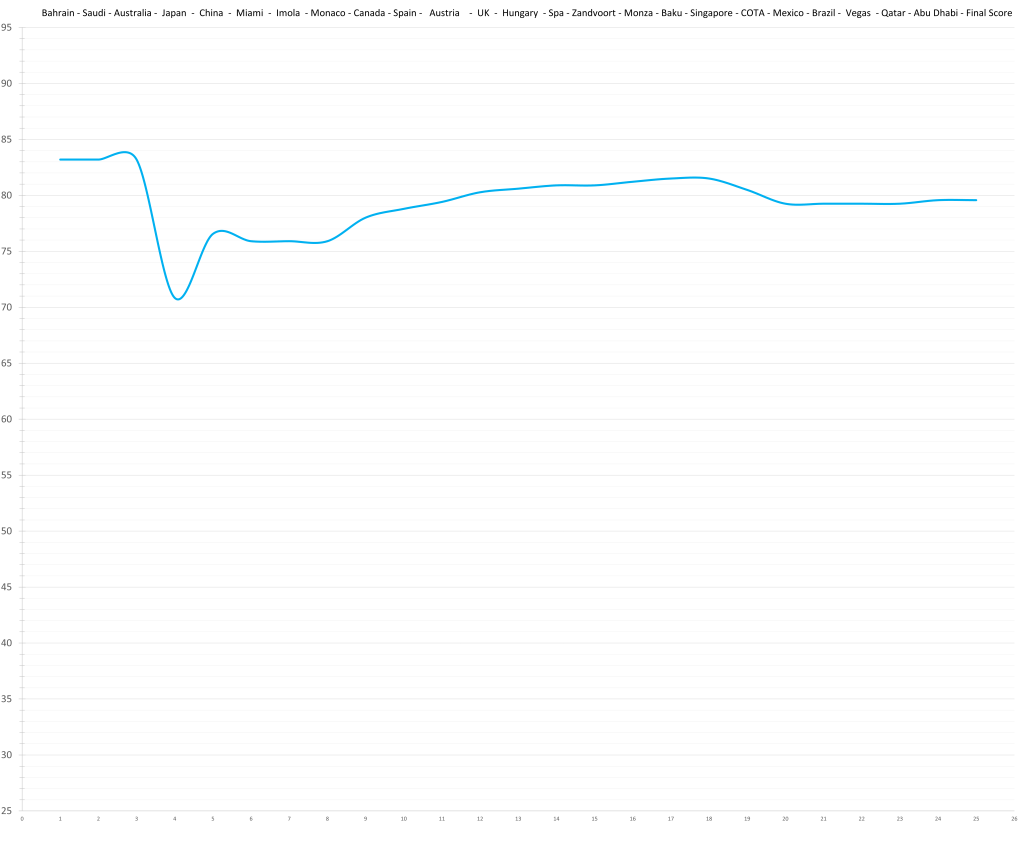
A Quick look At The Teams

- Red Bull
- McLaren
- Ferrari
- Mercedes
- Haas
- Alpine
- Aston Martin
- RB
- Williams
- Sauber
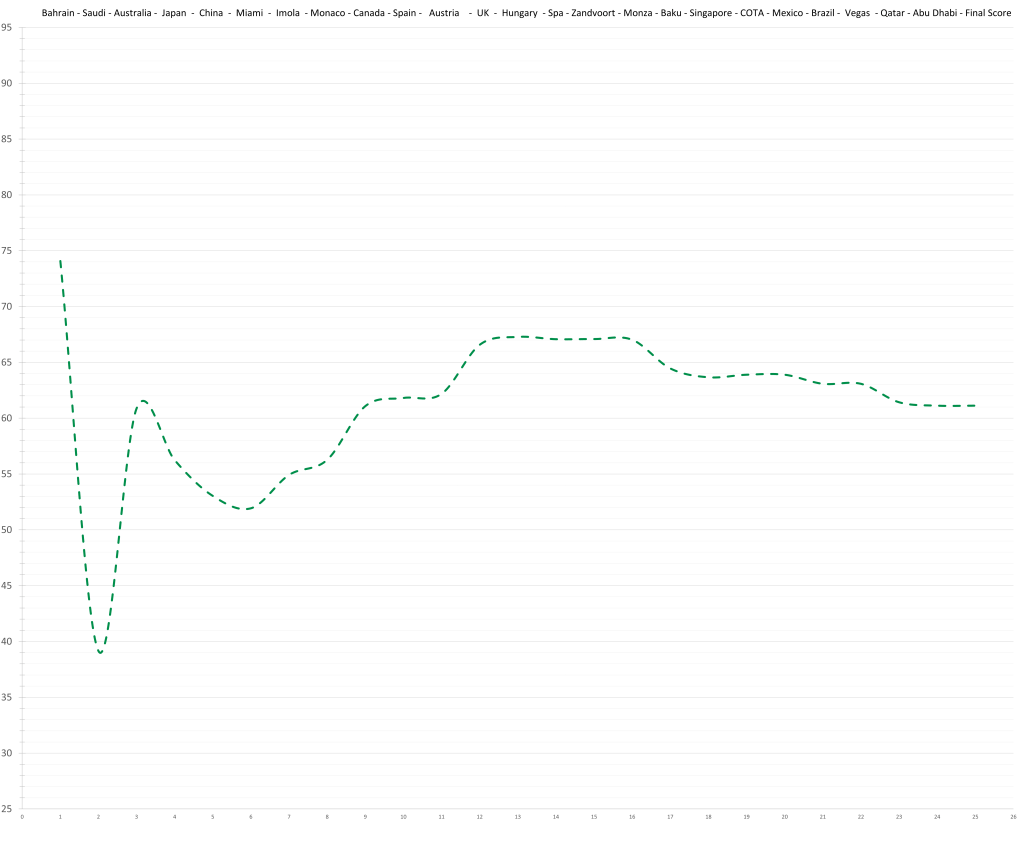
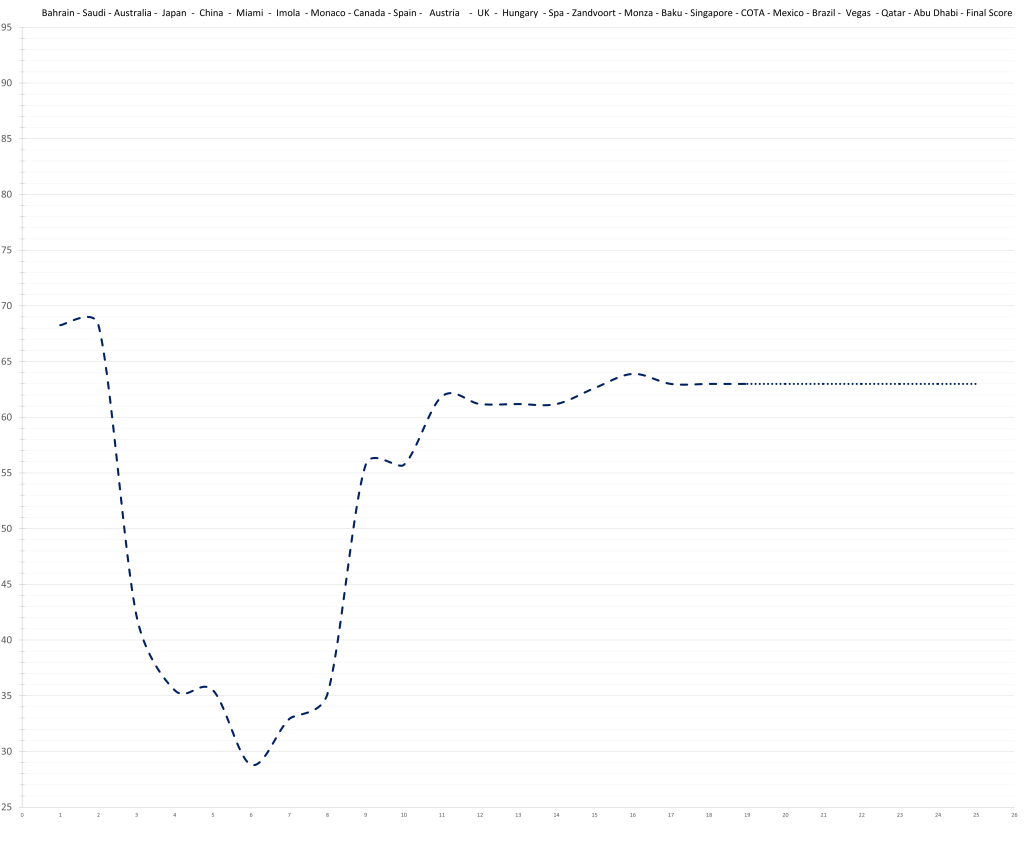
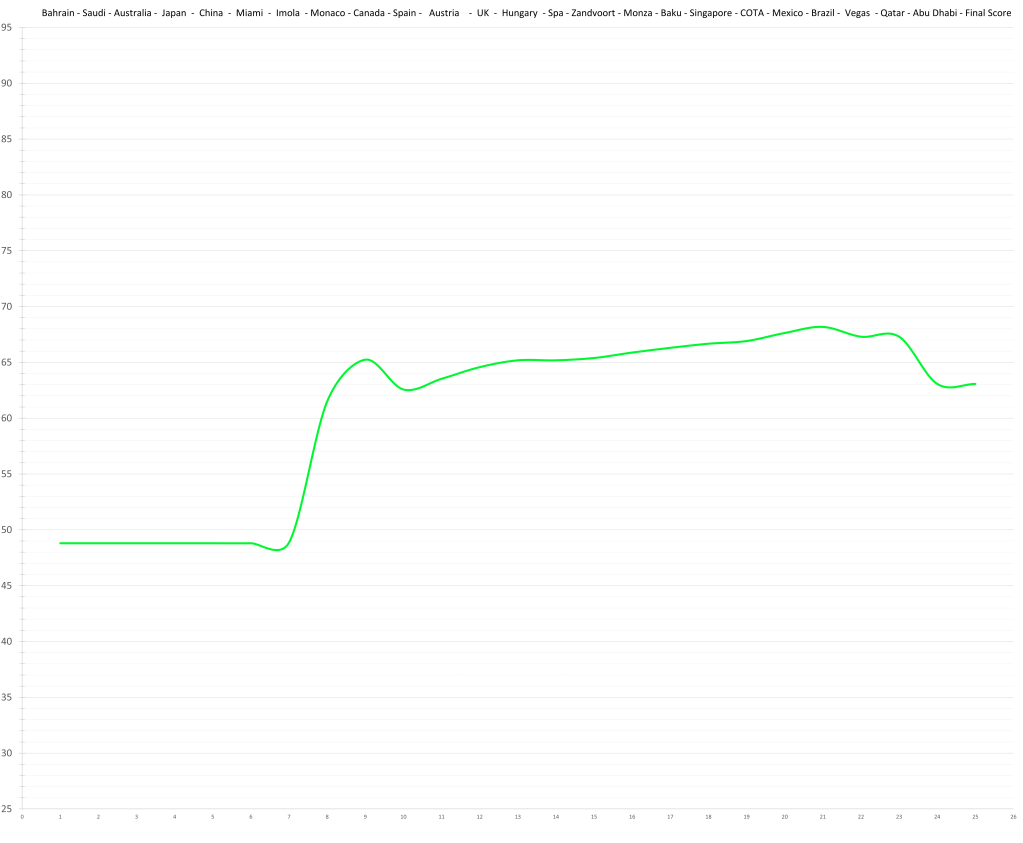
Red Bull is rated as the best team over the whole year. From Miami onwards, McLaren lead Red Bull by some margin, but the first few races RBR were so dominant that Sergio Perez was able to beat everyone else. That is enough to more than neutralize the gap since, additionally (and this is often forgotten), McLaren weren’t even competitive with Ferrari during that stretch.
In no news to anyone, Aston Martin, Alpine and Sauber have suffered an incredible loss of performance compared to everyone else. This leaves Haas at the spear end of the midfield. However, Alpine’s late season form and especially their double podium catapulted them ahead of what used to be Torro Rosso and Aston Martin.
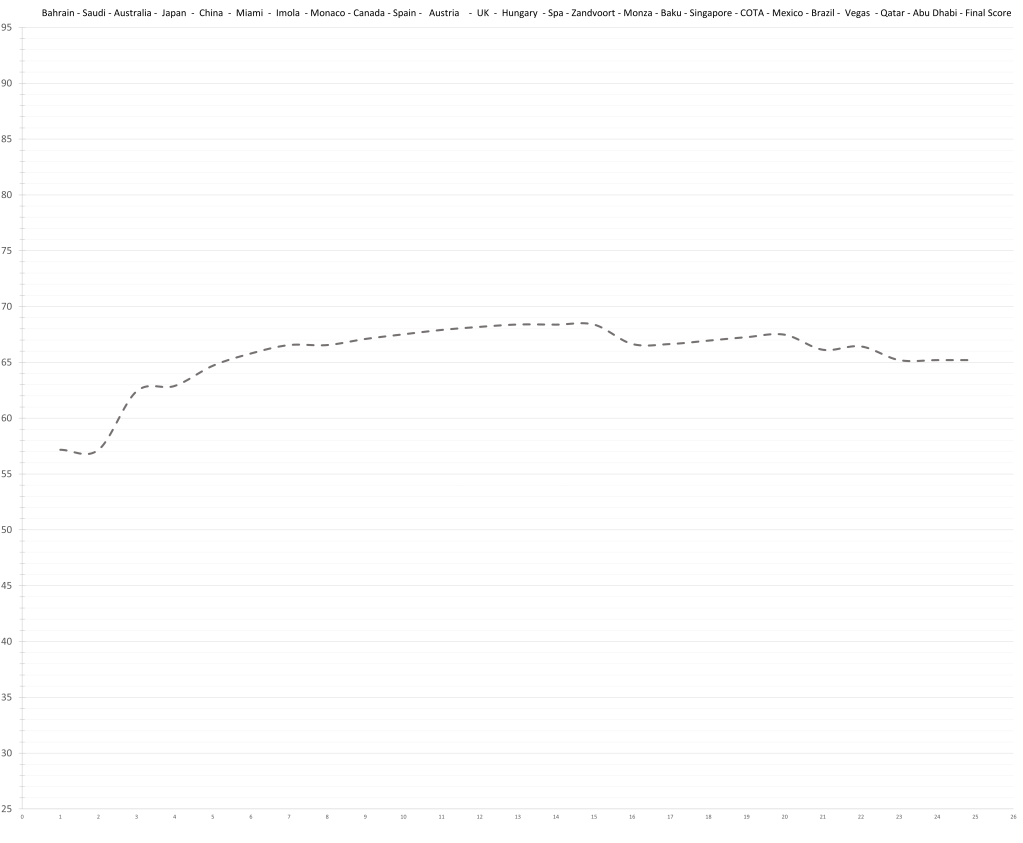
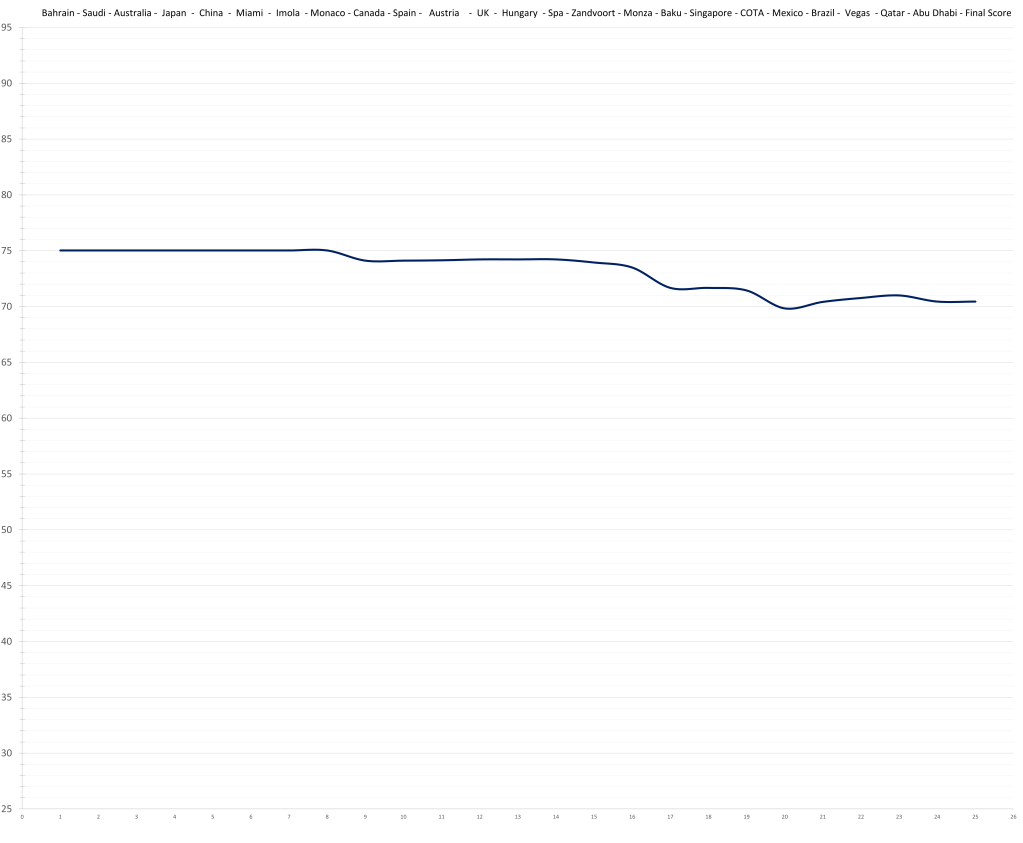
Although Mercedes (81.1) and McLaren (80.9) had very good driver pairings, Ferrari clearly takes the cake with Sainz back to his best and Leclerc being Leclerc. With a driver rating of 85.9, they stand among the best pairings of all time. Only two combinations have been clearly better so far: Prost-Senna in 1988, and Senna-Berger in 1991.
At Haas, Magnussen tanks the team driver rating to 59.2, while Sauber still has the 2nd lowest rated driver pairing (62.2).

Leave a comment