
The “Something, Something… Diffuser” Era
started with fairytales, and ended in frustrating domination. The era saw the most prescriptive set of regulations yet, and was marked by teams trying to exploit the diffuser to its fullest through ingenuity and loopholes. In a rare instance, the widely agreed best driver of the era didn’t win a single title. The mathematical model seeks to eliminate the factor car by only measuring drivers against their teammates.
How Does It Work?
My model was inspired by the amazing f1metrics model and therefore shares a significant portion of its methodology.
Step 1 was to introduce a unified points system. P1 gets 10p, P2 gets 10p*0.72=7.2p, P3 gets 7.2p*0.72=5.18p …. etc. all the way to P20. Driver related DNFs are scored with 0p.
Then the 2 teammates get their points assigned for every race. Races where one driver has mechanical issues are excluded (or corrected if possible). Driver errors and other incidents are also excluded (or corrected if possible). Now the points are tallied up and converted on an s-curve. The difference between the two values of the drivers is the performance difference between them.
In combination with functions for age and experience (I use those of the f1metrics model), doing this with all drivers over a lot of seasons, results in a pretty sturdy web of relative driver performances. While building this web, I am not looking for a compromise of all seasons but instead a most perfect fit.
Season Ratings
Now that I have performance ratings (later referred to as ceiling/pace/potential) for the drivers, I can get a value for the car/team in a season since
(points)=(driver performance)+(car performance)
and therefore
(car performance)=(points)-(driver performance)
The driver errors are then added back in, giving a new points total, and through
(points)-(car performance)=(driver performance)
I get the actual performance of the drivers in that season. Those performance ratings are then translated back over the s-curve to give a “points per race rating” which goes from 0-10. That is then multiplied by 10 to get a neat driver score of 0-100.
As you can see, the major difference to the f1metrics model is the handling of driver errors. In my opinion this results in more accurate ratings as the amount of errors a driver makes can vary widely from season to season. Secondly, it has the advantage of untieing teammates in a season. A drivers rating won’t automatically get boosted just because his teammate is having a shocker.
At its core the model is assessing a drivers ability to score points with
(total points)=(possible points)-(lost points)
This can be abstracted onto the drivers. Simplified the drivers’ season ratings can then be understood as
(driver rating)=(driver pace)-(driver mistakes)
To help give some perspective for the ratings I made these tiers:
- S – above 89
- A – above 82
- B – above 73
- C – above 62
- D – above 50
- F – below 50
From going through all the data and seasons, I would say that generally a good season has a score above 73. Keep in mind, though, that there are no real cut lines.
Below, all drivers that managed to score higher than the average of the era in question are listed. Each driver has their own entry including a short summary and an overall rating. This rating is derived by calculating a weighted average over all the seasons of this era, with the best season weighing as much as all the other lower rated seasons together, the 2nd best season in turn weighing as much as all the other lower seasons together, and so on; it works like the standardized A paper sizes.
One of the advantages of this method is the adaptability concerning the number of seasons included. It allows for consideration of all seasons in the time frame, without majorly disadvantaging either those with more seasons, or those with fewer. Also included is a graph documenting the change of their season ratings and potential through the years. The potential roughly equates to pace and acts as a ceiling (moving with age and experience). It should give you a better understanding and context for the actual driver ratings in terms of underperformance, mistakes, consistency, speed etc.
The Baseline
An average driver would be expected around 62.5 between 2009 and 2013. The era had very average grids throughout. There were no big outliers in either direction, and 62.5 is also around average historically. Maybe a bit surprisingly for some people, 2012 is the lowest rated season owed to a steep drop off after the top 5 or 6 performers. Over the 5 years of this era 14 drivers beat the average.
The “Above Average Assortment”

14 – Nico Hulkenberg
The model doesn’t rate Nico Hulkenberg particularly highly, attributing him with a ceiling of only 74.6 which isn’t exaxtly noteworthy. However, credit where it’s due, he acclimated to Formula One quicker than his peers, like Perez and Ricciardo, and therefore just about clears the baseline while the others don’t. His rating is somewhat carried by his era-best performance in 2013, where he scored 70.5 against a weak Esteban Gutierrez to come 7th in the season rankings.
13 – Mark Webber

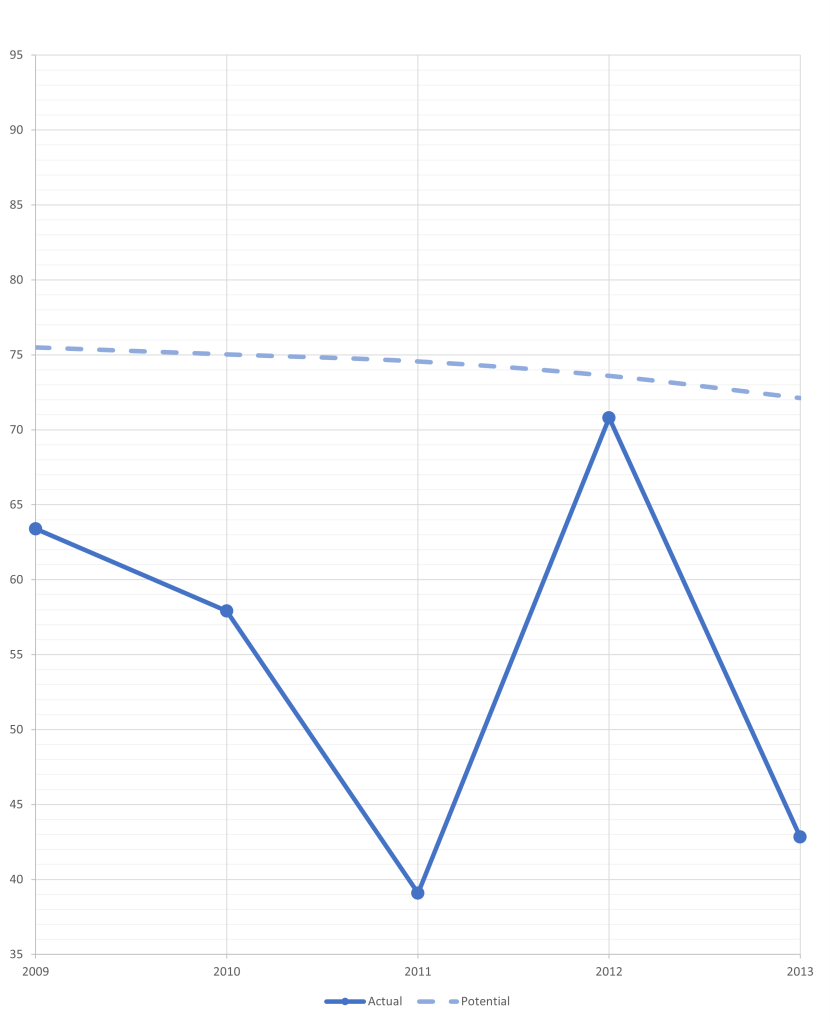
Mark Webber was Mr. Volatile at Red Bull. 2009, 2010, and 2012 adhere to expectations. 2012 is his highest rated season (70.8, 7th), but by this point, Vettel was in his prime making the gap bigger than in 2010 which is commonly called his best season. The model actually has no time at all for his 2010; it was a messy and lucky season. On the other hand, 2011 and 2013 are massive underperformances where he was among the worst drivers on the grid. 2011 is easily pinned on the change to Pirelli tires which he wasn’t able to adapt to quickly enough. 2013 is a little blurrier. He was seemingly fine in the first half but completely fell off for the second. This could be down to two things: The tire rule change in the middle of the season perhaps led to a repeat of 2011, or his imminent retirement paired with no hope for the championship could have been the cause of his underperformance.
Generally, Webber was a decent but rarely good driver. His ceiling of 76.0 is equal to that of Barrichello, but the Brazilian was scoring both closer to his ceiling, and more consistently, making him undoubtedly the better driver in a direct comparison. Had he managed to win 2010, he would have clearly been one of the worst WDCs of all time, and by far the worst in the 21st century.
12 – Timo Glock

Timo Glock could have easily had a career as a decent midfield or number 2 driver; he proved as much against Jarno Trulli. Unfortunately, he then got into a difficult situation after Toyota folded their F1 team after 2009. At Virgin and Marussia, he was barely in the same races as the proper teams, and he never made his way back.
From 2010-2012, Glock was paired with a different rookie every season, and none of those drivers went on to get any more data points, meaning there is no verification of Timo’s driving level, and therefore no guarantee he didn’t underperform. In 2010, he completely annihilated di Grassi, in 2011, he comfortably beat Jerome d’Ambrosio, and in 2012 he beat Pic reasonably well. However, if the delta to Pic were representative, he would end up with a ceiling around 79, and while it isn’t impossible for a talent of that caliber to fall through the cracks, it seems unlikely to be true to reality. Because I found some evidence that the deltas of the model can also be found in GP2/GP3, I looked at Glock’s teammates before they entered F1. While the others could be placed just about where their deltas to Glock would expect them, Pic was indeed closer to Glock than his GP2 seasons would predict. That (GP2) ceiling for Pic (67.4) would lead to the 2013 Caterham being rated the same as the 2012 car instead of much lower. While this is not good evidence, it is something, which is just a bit better than nothing, so I decided to use this ceiling for Pic, making 2012 an underperformance for Glock.
11 – Nelson Piquet Jr
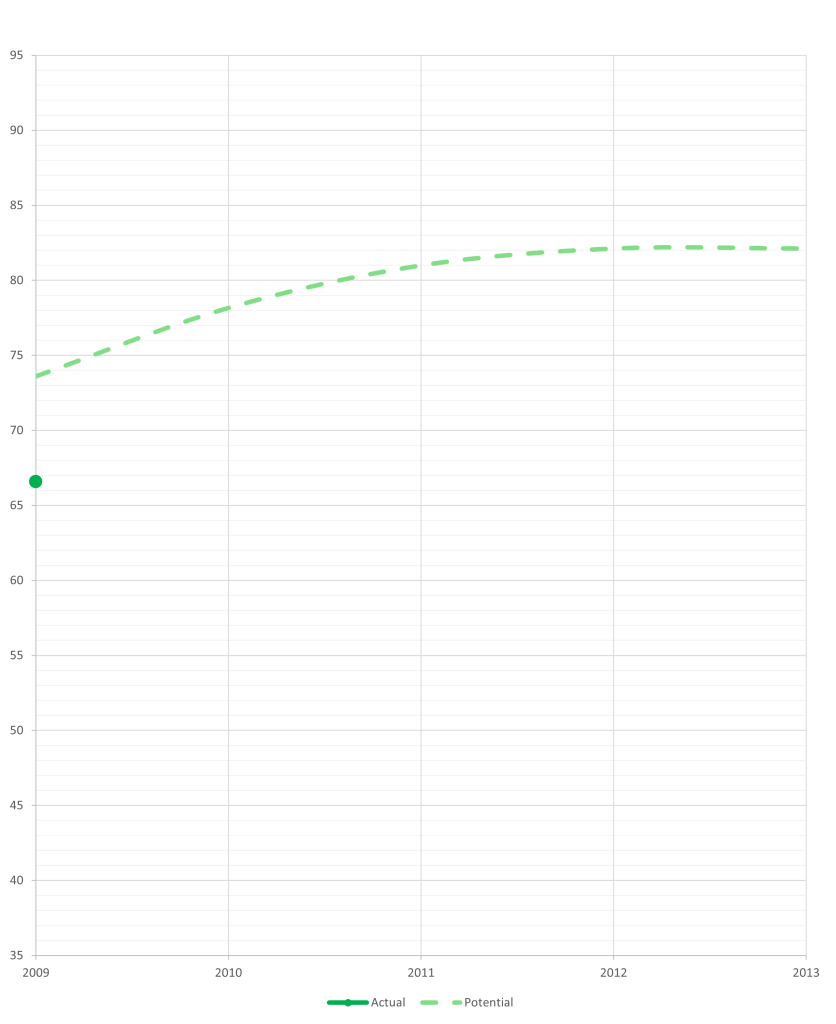
If he weren’t remembered for Crashgate, Nelson Piquet Jr probably wouldn’t be remembered at all. The model sees a similar case to Stoffel Vandoorne, in that he was destroyed by Alonso, but could probably have held his own quite decently against almost any other driver. Obviously, one and a half seasons are not a wealth of data, but since the deltas are matching the expected developement from one year to the other, it’s very likely a representative assessment. There isn’t much else to say about Piquet Jr, especially since he only drove for half a season in this era, except that the fact that he drove for only half a season in this era is pretty unfortunate for him, considering much worse drivers have had far more time in Formula 1.
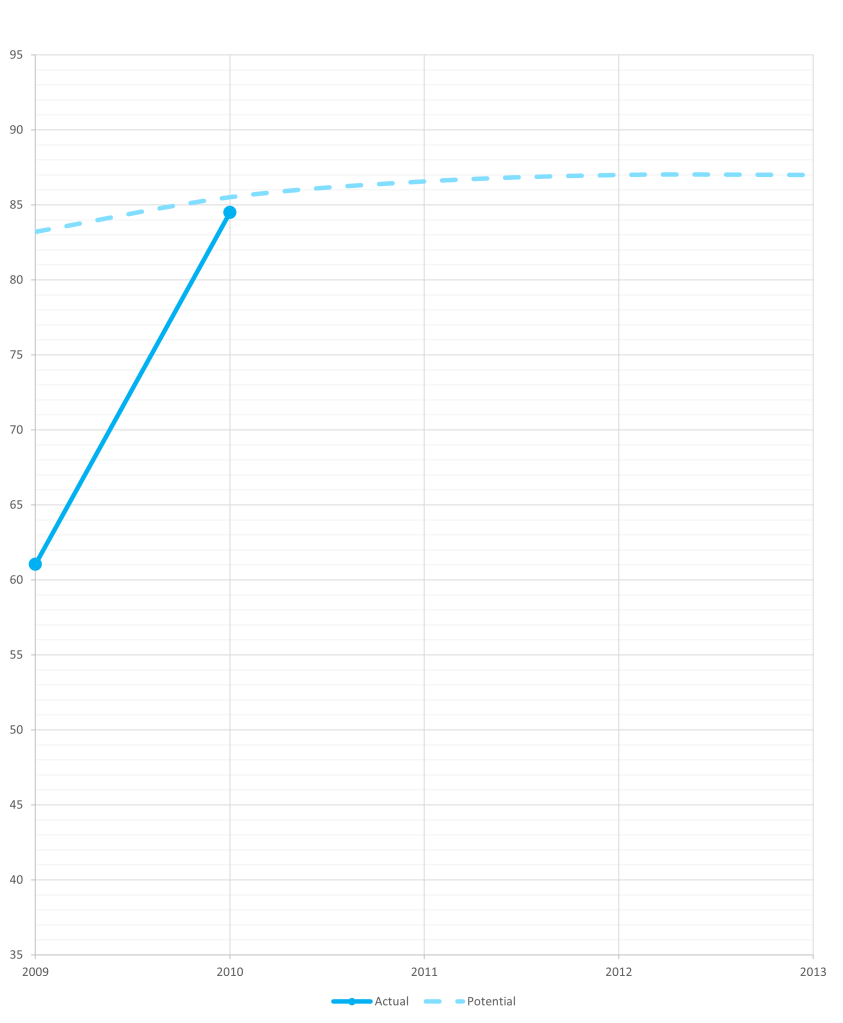
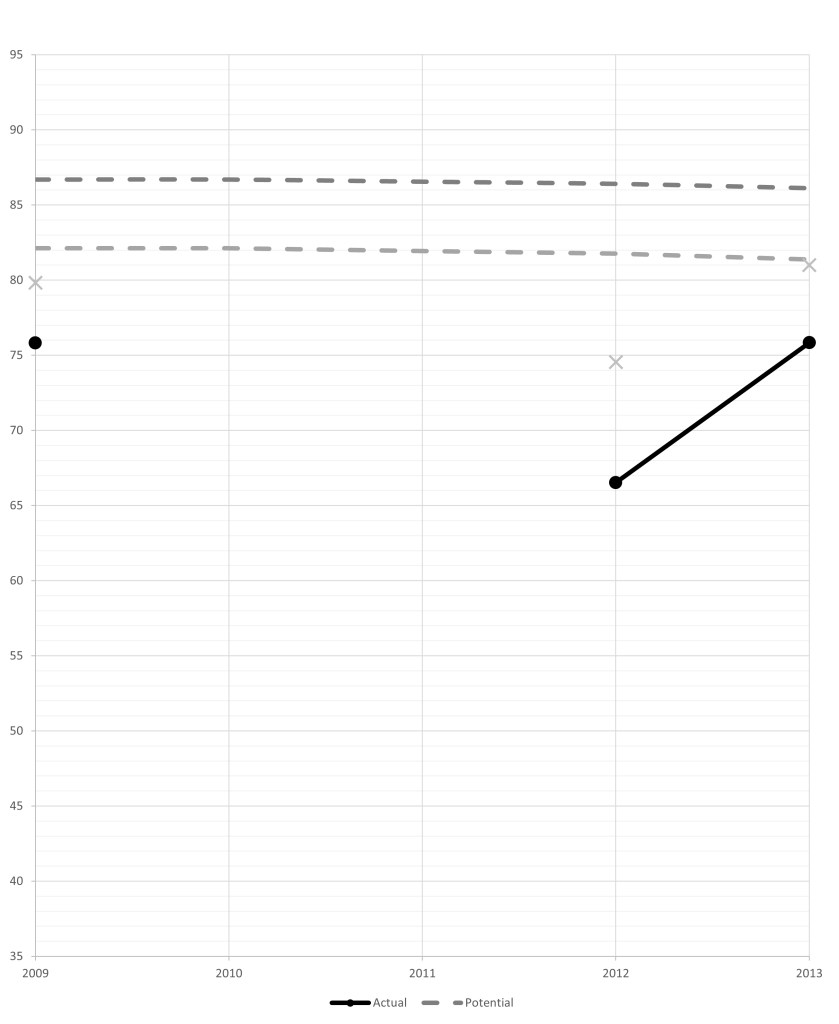
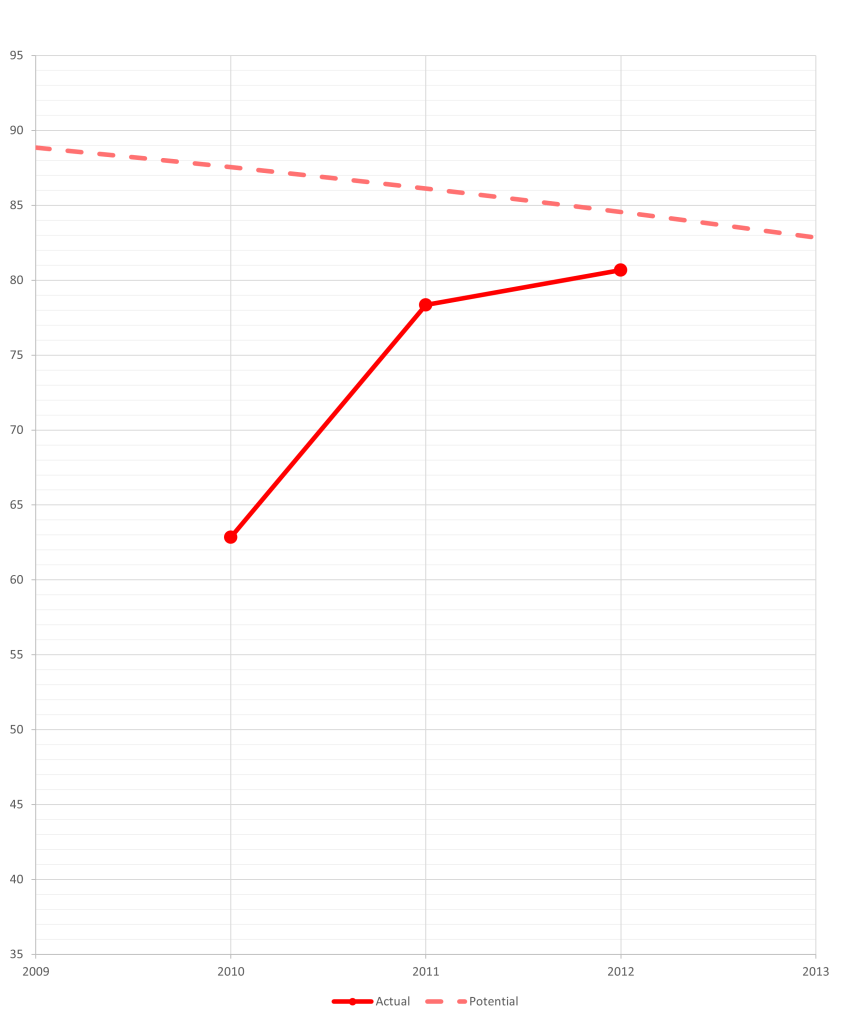
10 – Felipe Massa

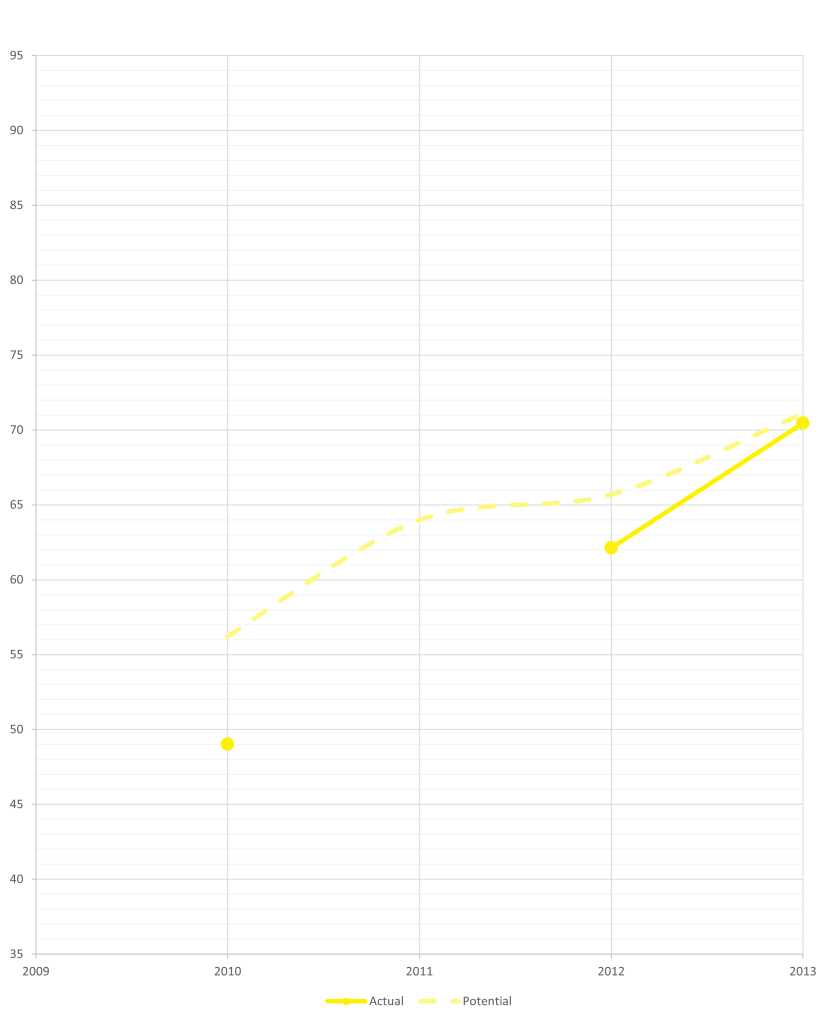
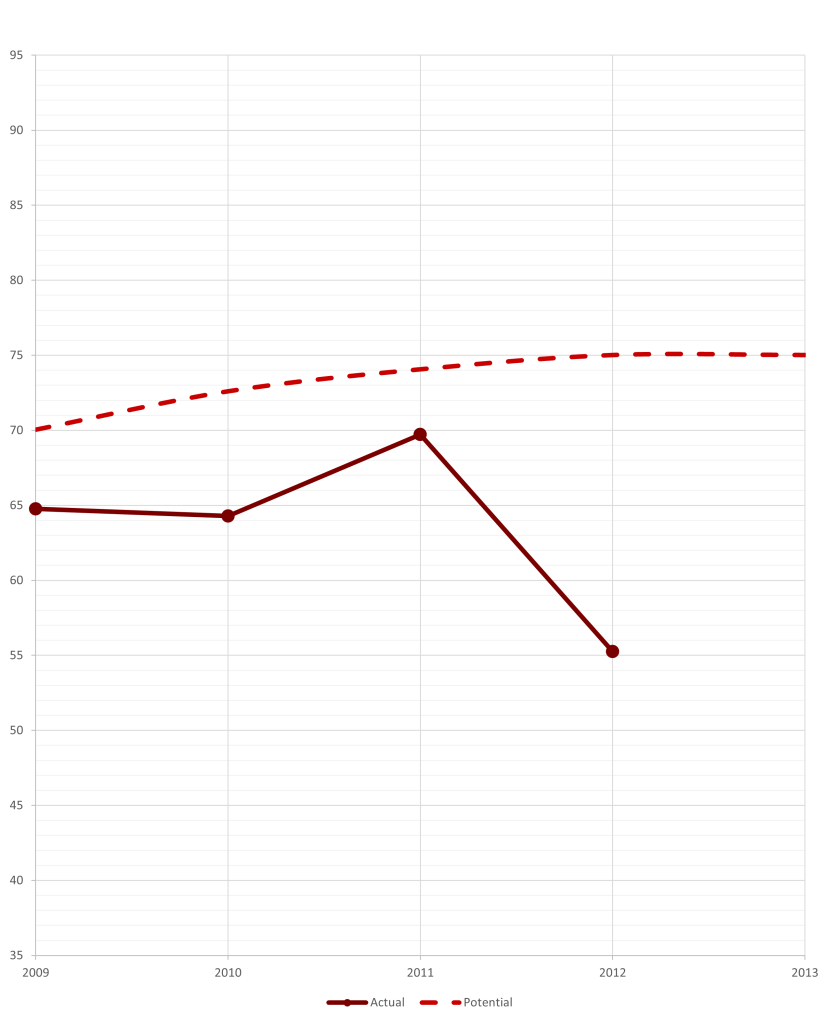
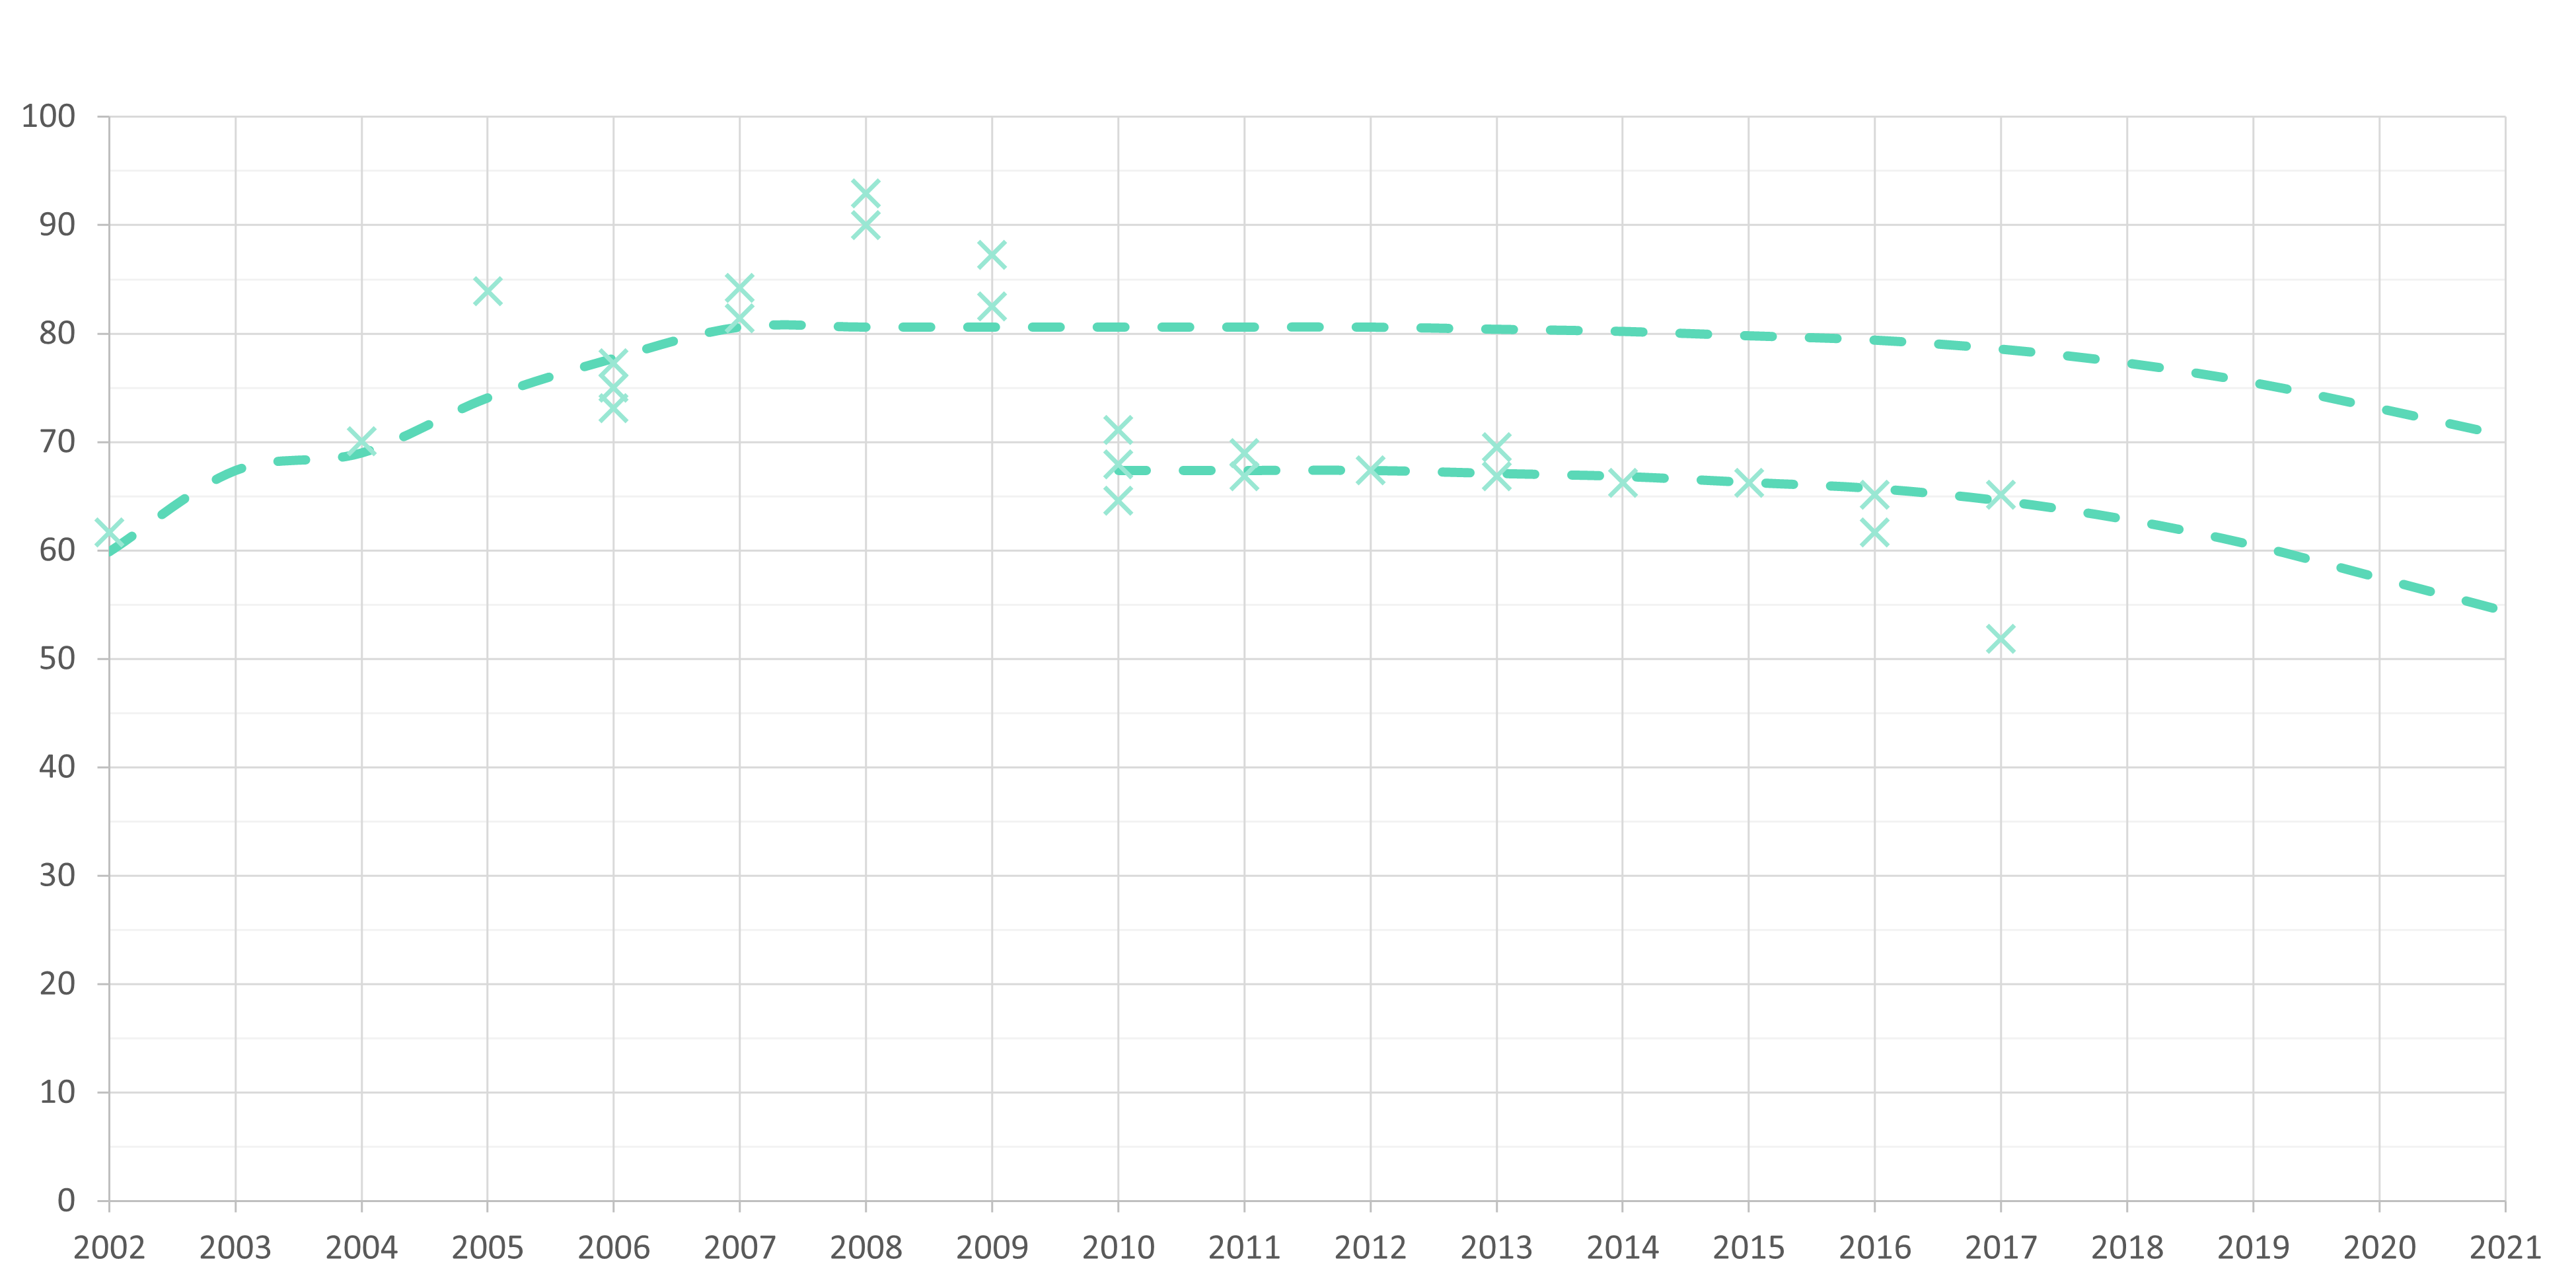
Felipe Massa was thoroughly average from 2010 to 2013. 2009 is an entirely different story. The model makes a very strong case for Massa never getting back to his level after his horrific accident. The below diagram displays where his possible deltas would place him in every season (marked with x), and the resulting ceiling curves. Due to the clear, abrupt, and huge difference in the deltas, as well as their consistency across multiple teammates, there is little doubt in my mind, that Massa was a completely different driver from 2010 onwards. For this reason he was split into 2 seperate ceilings; 80.6 before the accident, and 67.4 after the accident.
The model ranks him 2nd in 2009 (with the caveat of only doing half of the season), narrowly ahead of Lewis Hamilton. With a rating of 79.5, it is Massa’s highest rated season. His accident literally came at the height of his powers. In a world where that spring never came loose, it is not unthinkable for Massa to have challenged for the title until relatively late in 2010. Alonso had a weak first half of the year, and while Massa wouldn’t have been as quick as Alonso, he might have been ahead on points going into the summer break. However, from 2011 onwards, Alonso would certainly not be in any danger of being beaten by Massa over a season. Their relationship would have been closer to that of Hamilton and Button in 2012 (minus the McLaren incompetence), or Hamilton and Rosberg (2014-2015).
The “Good Ones”
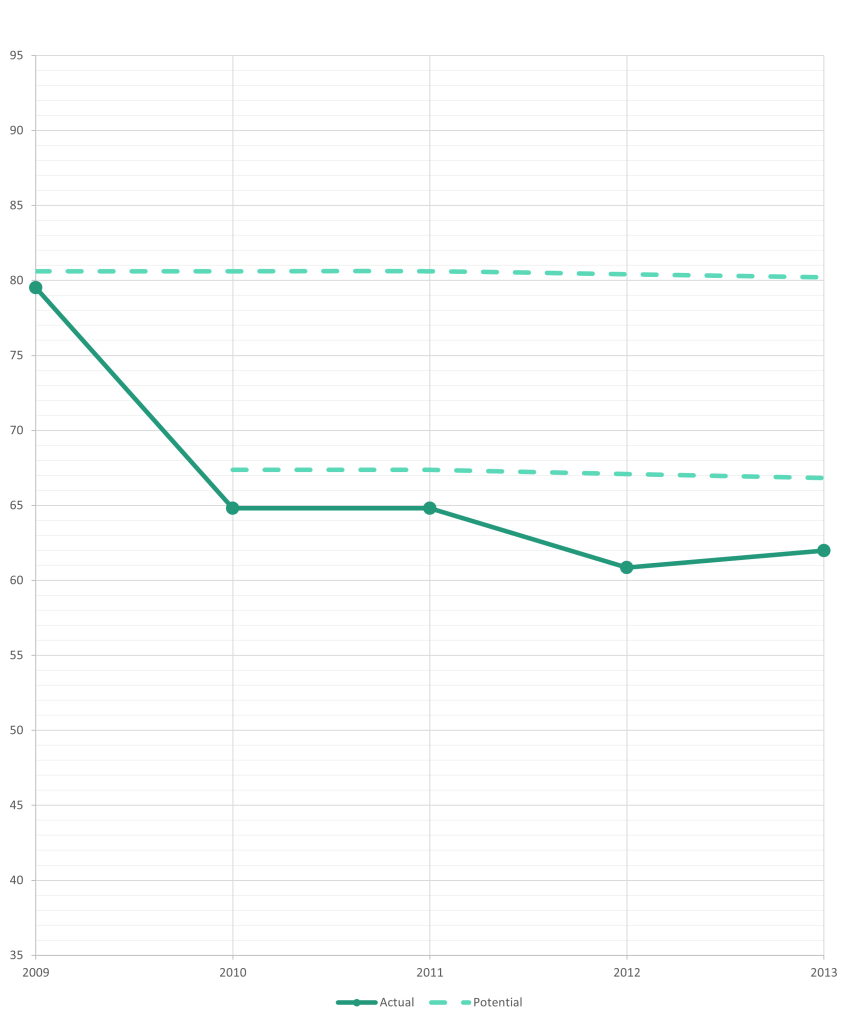
9 – Robert Kubica
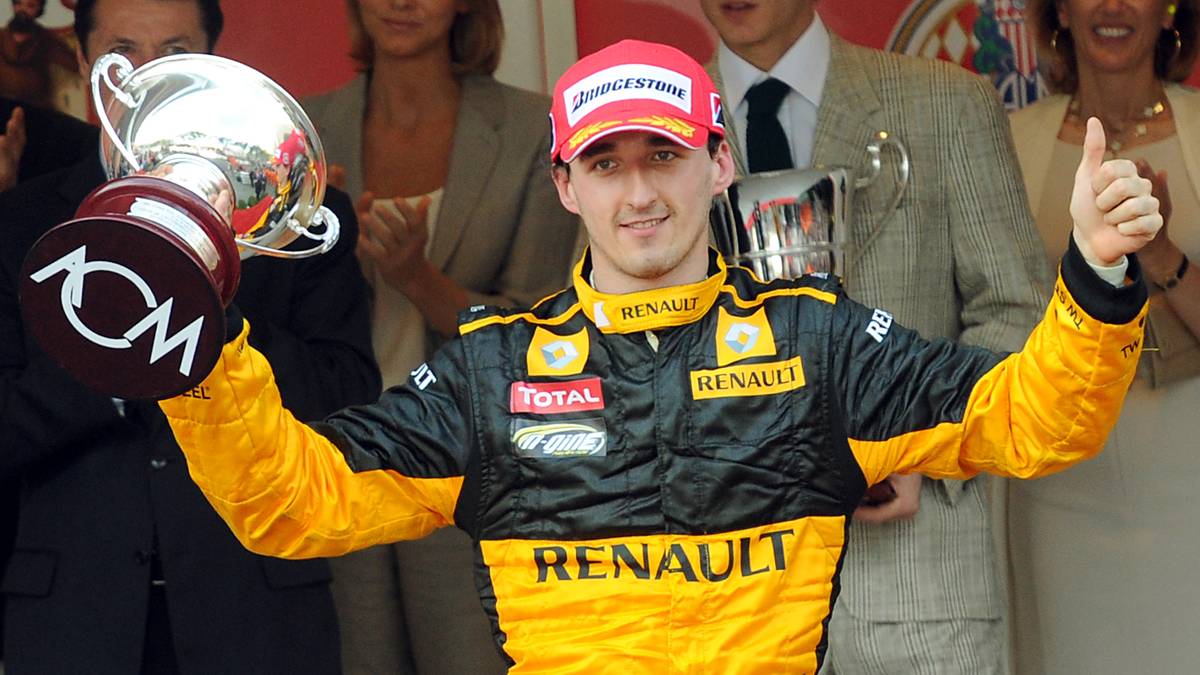
A relatively poor 2009 where he underperformed his expected pace means Kubica ranks pretty low for the whole era; especially, since his accident prevented him from getting more scores. His 2010 on the other hand was fantastic, and makes him the 2nd highest rated driver of the season while being practically rated equal to Hamilton, who takes the top spot.
The model puts his ceiling at 87.0, meaning he would have likely been one of the best drivers on the grid for the foreseeable future, similar to Vettel, but not on the same level as the true greats, Alonso and Hamilton.
8 – Jules Bianchi

Don’t take this too seriously. Jules Bianchi has no real connection to any driver apart from Max Chilton. Max Chilton has only one connection himself, to Bianchi. That means, Bianchi could not be rated by the model, since he is completely isolated. I played around with F2/F3 and found that there is some evidence that the adjusted (for age and experience) deltas found by the model can also be found between teammates in the junior categories. I went ahead to look at the junior record of one of the biggest what-ifs in recent history and puzzled around him with every driver I had from the model. The resulting ceiling (plus age and experience effects) was then applied to his 2013 and 2014 seasons. Of course the uncertainty around Bianchi is much higher than normal and his rating should be viewed with extra caution. Apart from that, there is no guarantee that the deltas would be the same in F1. Since Bianchi is on an island, his inclusion has no effect on anything else and is therefore harmless.
7 – Kimi Raikkonen


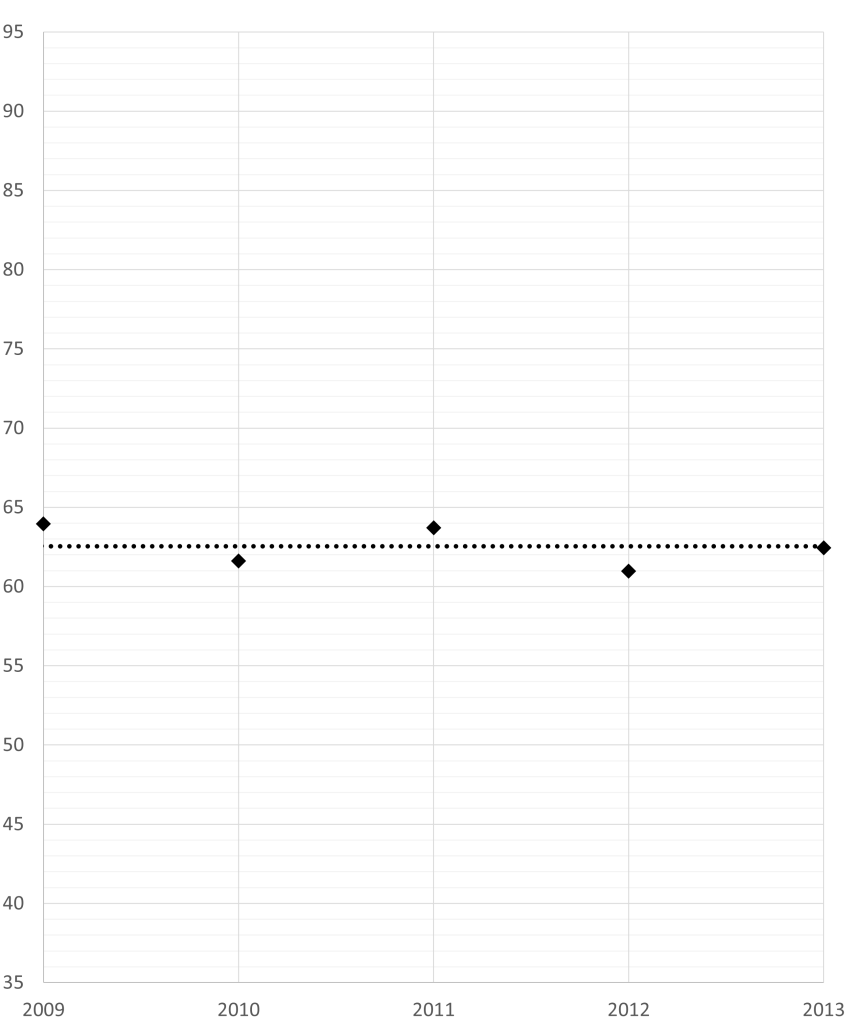
Although often held in high regard, 2012 is rated as Raikkonen’s worst season during this time stretch. The delta to Grosjean is much smaller than in 2013.
The model finds Raikkonen to not be the same driver at this point, as he was in his prime. Therefore, the above shown line for his potential holds little value. Some of his later seasons seem to adhere to a different trajectory, though. 2013 matches with 2014, 2016 and 2018 of his 2nd Ferrari stint. Below, you can see what that new potential trajectory might look like. The ‘x’s mark where the delta to his teammate would set his pace for each season.
6 – Michael Schumacher
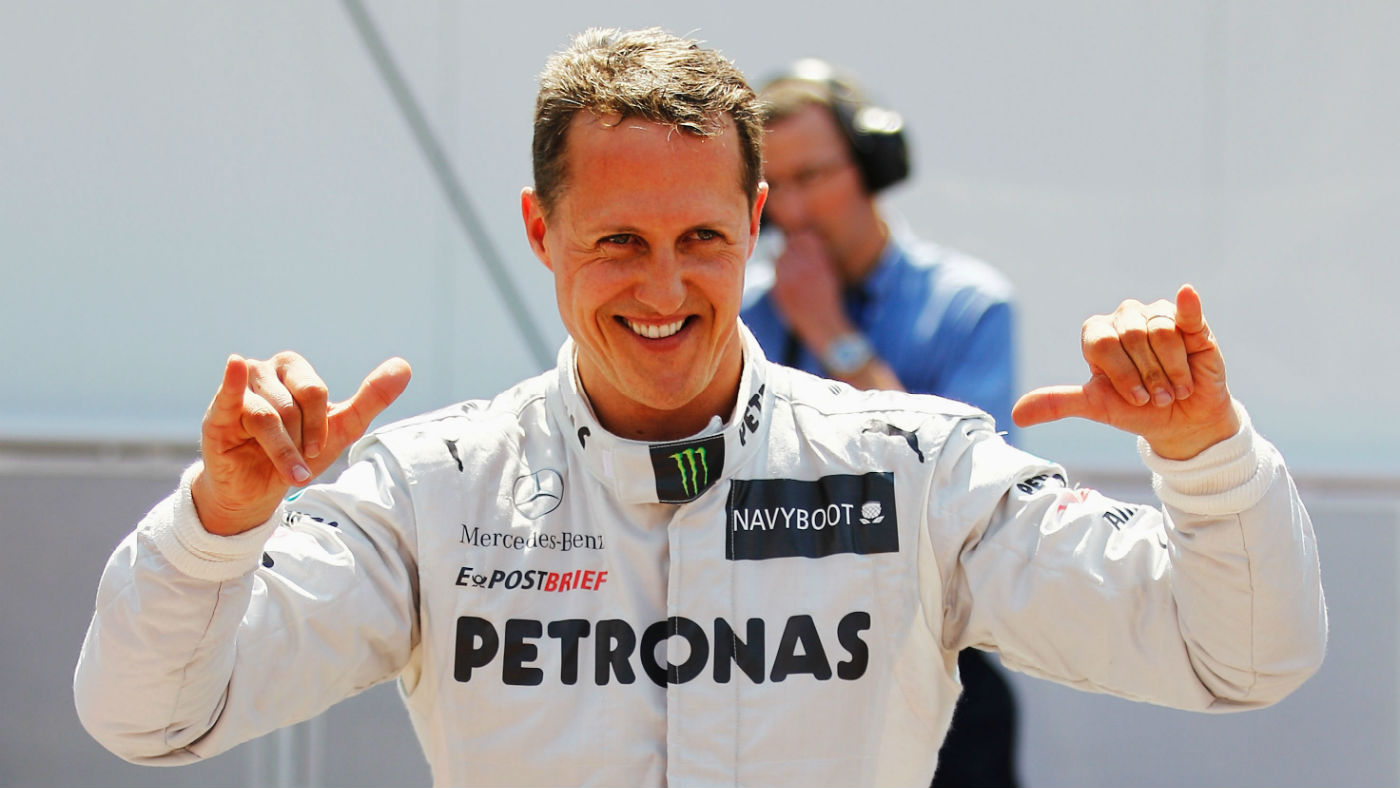
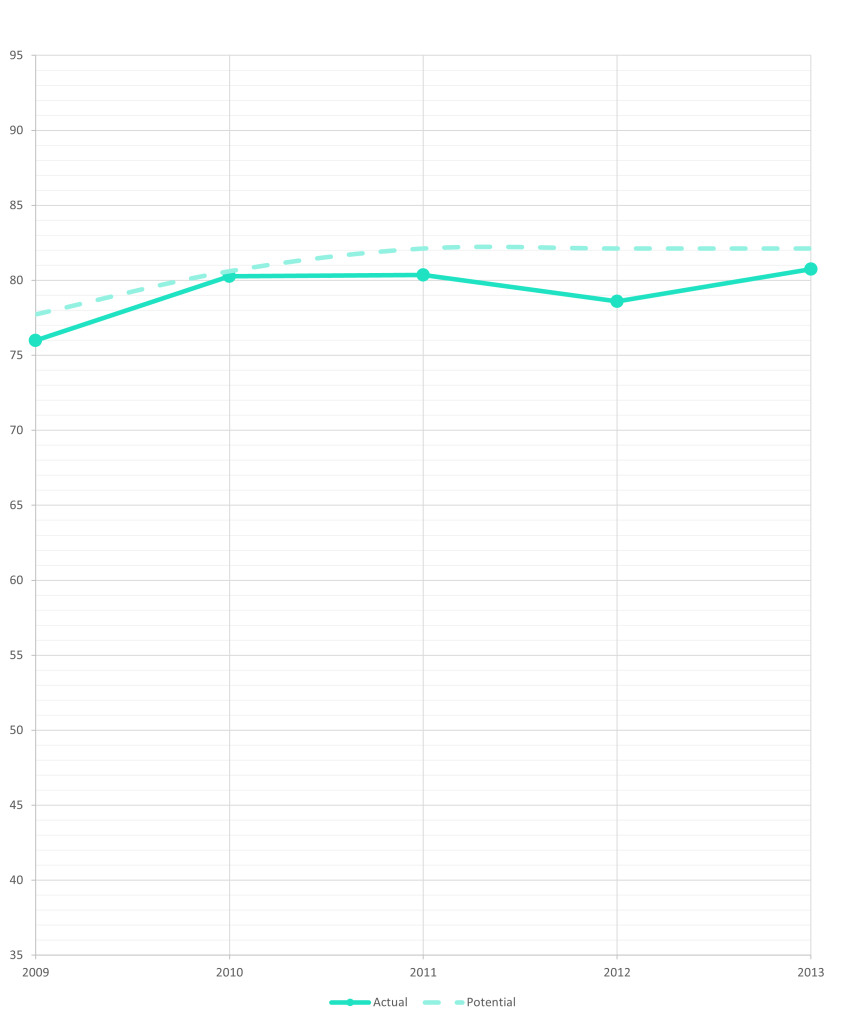
It was not the comeback many expected or wanted, but apart from a very weak 2010 (where he still battled effects of a major neck injury), Schumacher’s deltas to Rosberg match the model’s expectations of a Michael Schumacher at age 42/43. The high amount of mistakes was much more unusual for him, but that improved as well from year to year. In 2012, the model even rates Schumacher slightly higher than Rosberg.
What if he stayed? Schumacher retired for the second time after he was made aware that Mercedes had a chance to sign Hamilton and that they were pursuing it intensely. If Lewis Hamilton never had a falling out with McLaren, this scenario doesn’t arise and Schumacher-Rosberg is likely the line-up for at least 2013 and 2014. The model sees the two of them very evenly matched in those years and whoever comes out ahead on points would likely be down to mistakes and luck. Rosberg’s mechanical failure in the double points finale could have easily made a difference and might have led to one of the most heavily asterisked titles of all time. Beyond 2014, it’s hard to see Schumacher coming out ahead of Rosberg, although the dominance of the Mercedes makes it entirely possible.

5 – Jenson Button

Even though 2009 was not stellar, this era cemented Jenson Button as a worthy world champion. He followed his title up with 2 very good seasons in 2010 and 2011, beating Lewis Hamilton in the process. At his peak in 2011, he is ranked 3rd behind only Alonso and Vettel. However, he got successively worse after that, following 2011 up with a flawed 2012 and a mediocre 2013.
4 – Nico Rosberg

Nico Rosberg was the most consistent driver of this era. He never ranks outside the top 5 (4x 4th, 1x 5th), and his ratings all lie between 76 and 81.
At the time, he was pretty underrated which is not too surprising since his only real point of comparison was Webber in 2006, his rookie season. This perception held on until at least 2013, when he was paired with Hamilton and fared pretty well. Obviously, this also influenced the opinions around Schumacher’s comeback.
3 – Sebastian Vettel
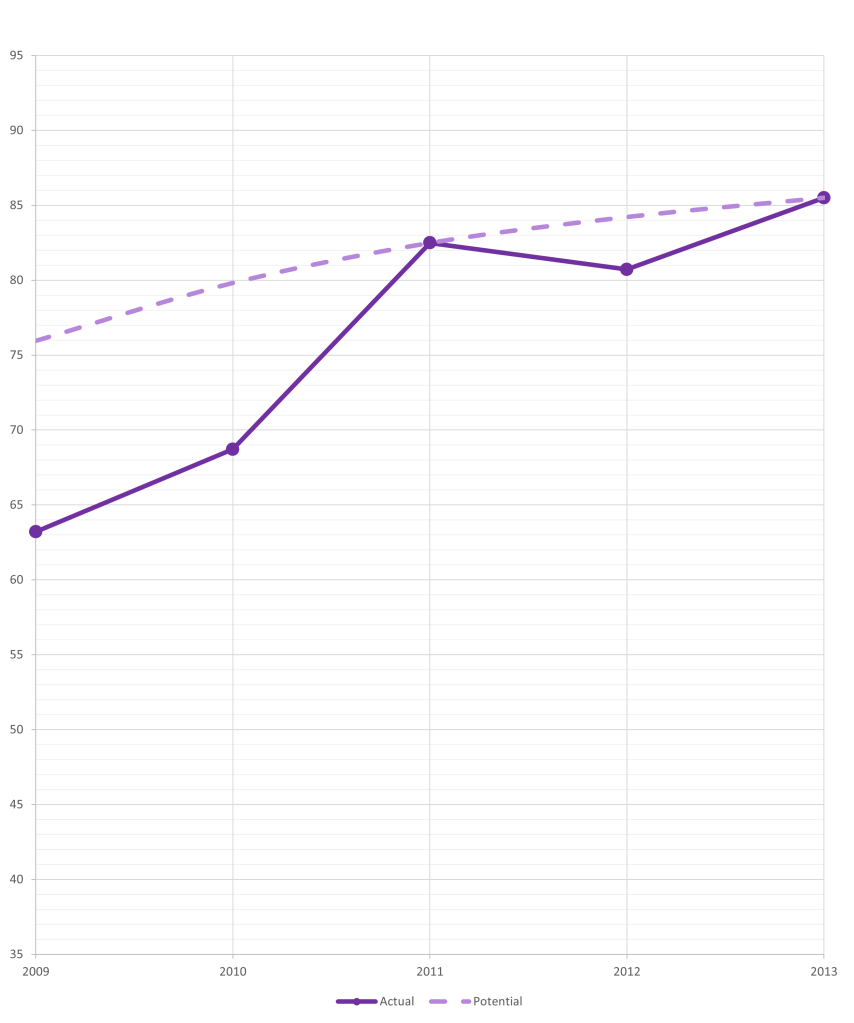
The most successful driver of this stretch, Sebastian Vettel rarely also gets named as the best driver of this stretch. Unfortunately, the model would agree. While he reaches an impressive peak in 2013 (85.5, 2nd), he is not once ranked first or close enough to be within uncertainty. However, by 2012 he had the 3rd highest potential, according to the model, meaning he was the 3rd quickest driver on the grid, and in his case, alone on an island with equal distance to the 2 in front and the next guys behind.
The “Greats”

2 – Lewis Hamilton

2012 was easily Lewis Hamilton’s best season of the era. The model rates it 87.2, yet he is only ranked 2nd that year, unlike in 2010. In 2010 he is given the top spot by the model with 85.2, his personal second best season in this era. 2011 marks a visible low point for the Brit. He fell behind his expected delta to Button (even though he still retained an advantage) while simultaneously playing magnets with Felipe Massa. Even with all of that it was surprisingly not such a bad season overall.
1 – Fernando Alonso

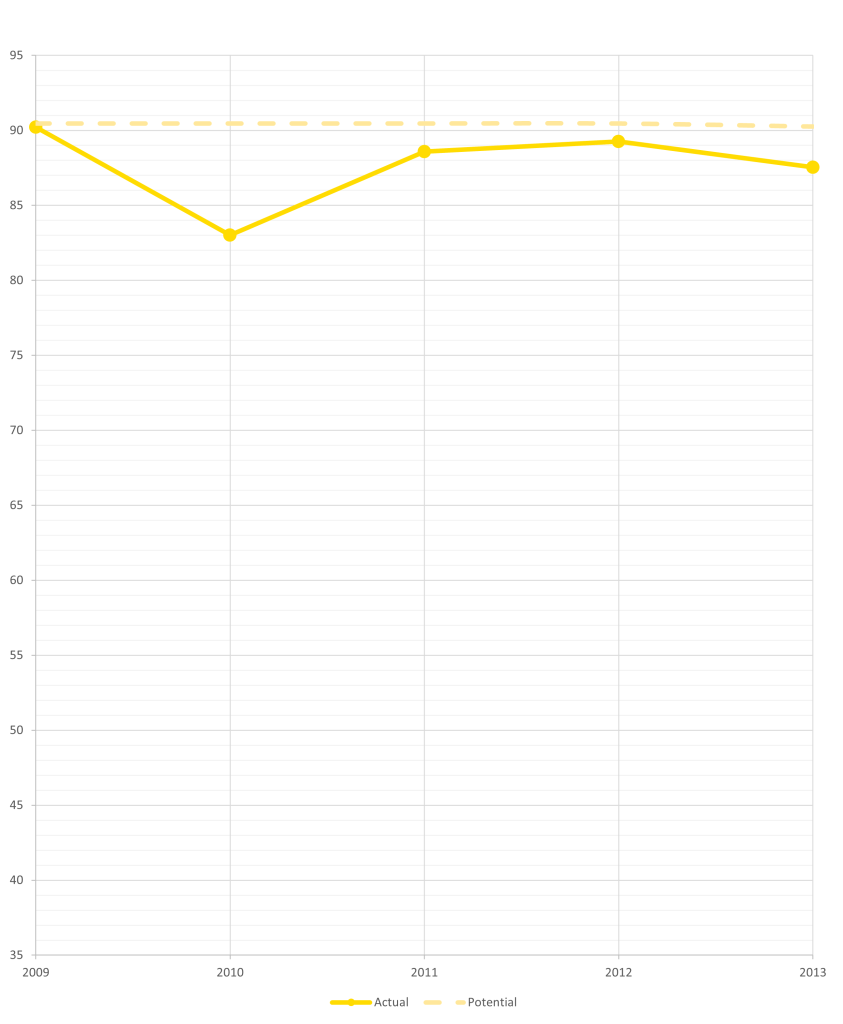
This was obviously Fernando Alonso’s prime. Most of his seasons here were very clinical. 2010 is the clear exception. His start to the year was very messy and littered with mistakes. Even though the Ferrari was not on the same level as the Red Bull, the title was definetly on the table and he technically had it in his own hands to make it happen, but he didn’t.
Contrary to popular consensus, the model doesn’t rate Alonso’s 2012 as one of the most exceptional seasons of all time. In fact, it currently only sits in 4th among Alonso’s own seasons, behind 2014, 2009, and 2006. Of course, with a rating of 89.3, it’s still a brilliant season, but not exceptional. 2011 is easily in the same category. The difference is, it wasn’t a title fight.
With 90.5, Alonso’s ceiling is among the highest in F1 history, and being the consistent and relentless scorer that he is, Alonso currently sits in 5th on the top list (1969-today). However, he doesn’t quite reach the heights of Schumacher (93.2), Senna (93.6), or Verstappen (92.9), pretty much taking him out of the GOAT conversation as far as the model goes.
The Whole Picture
Below I included the annual team principals ratings for comparison. Some observations:
- There seems to be a general adherence to the points standings, most obvious in Webber’s and Alonso’s rankings through the years, as well as the inclusion of the Force India Drivers.
- Expectations play a big role. For example, Hulkenberg was nowhere near better than Barrichello in 2010, yet he is ranked above him, likely due to being a rookie.
- Inconsistent criteria have to be expected since, at the end of the day, the team principles are also just humans, ranking mostly on subjective opinion, and on top of that, they are obviously not one entity but 10-12 different people (and not even the same ones every year) with different views.
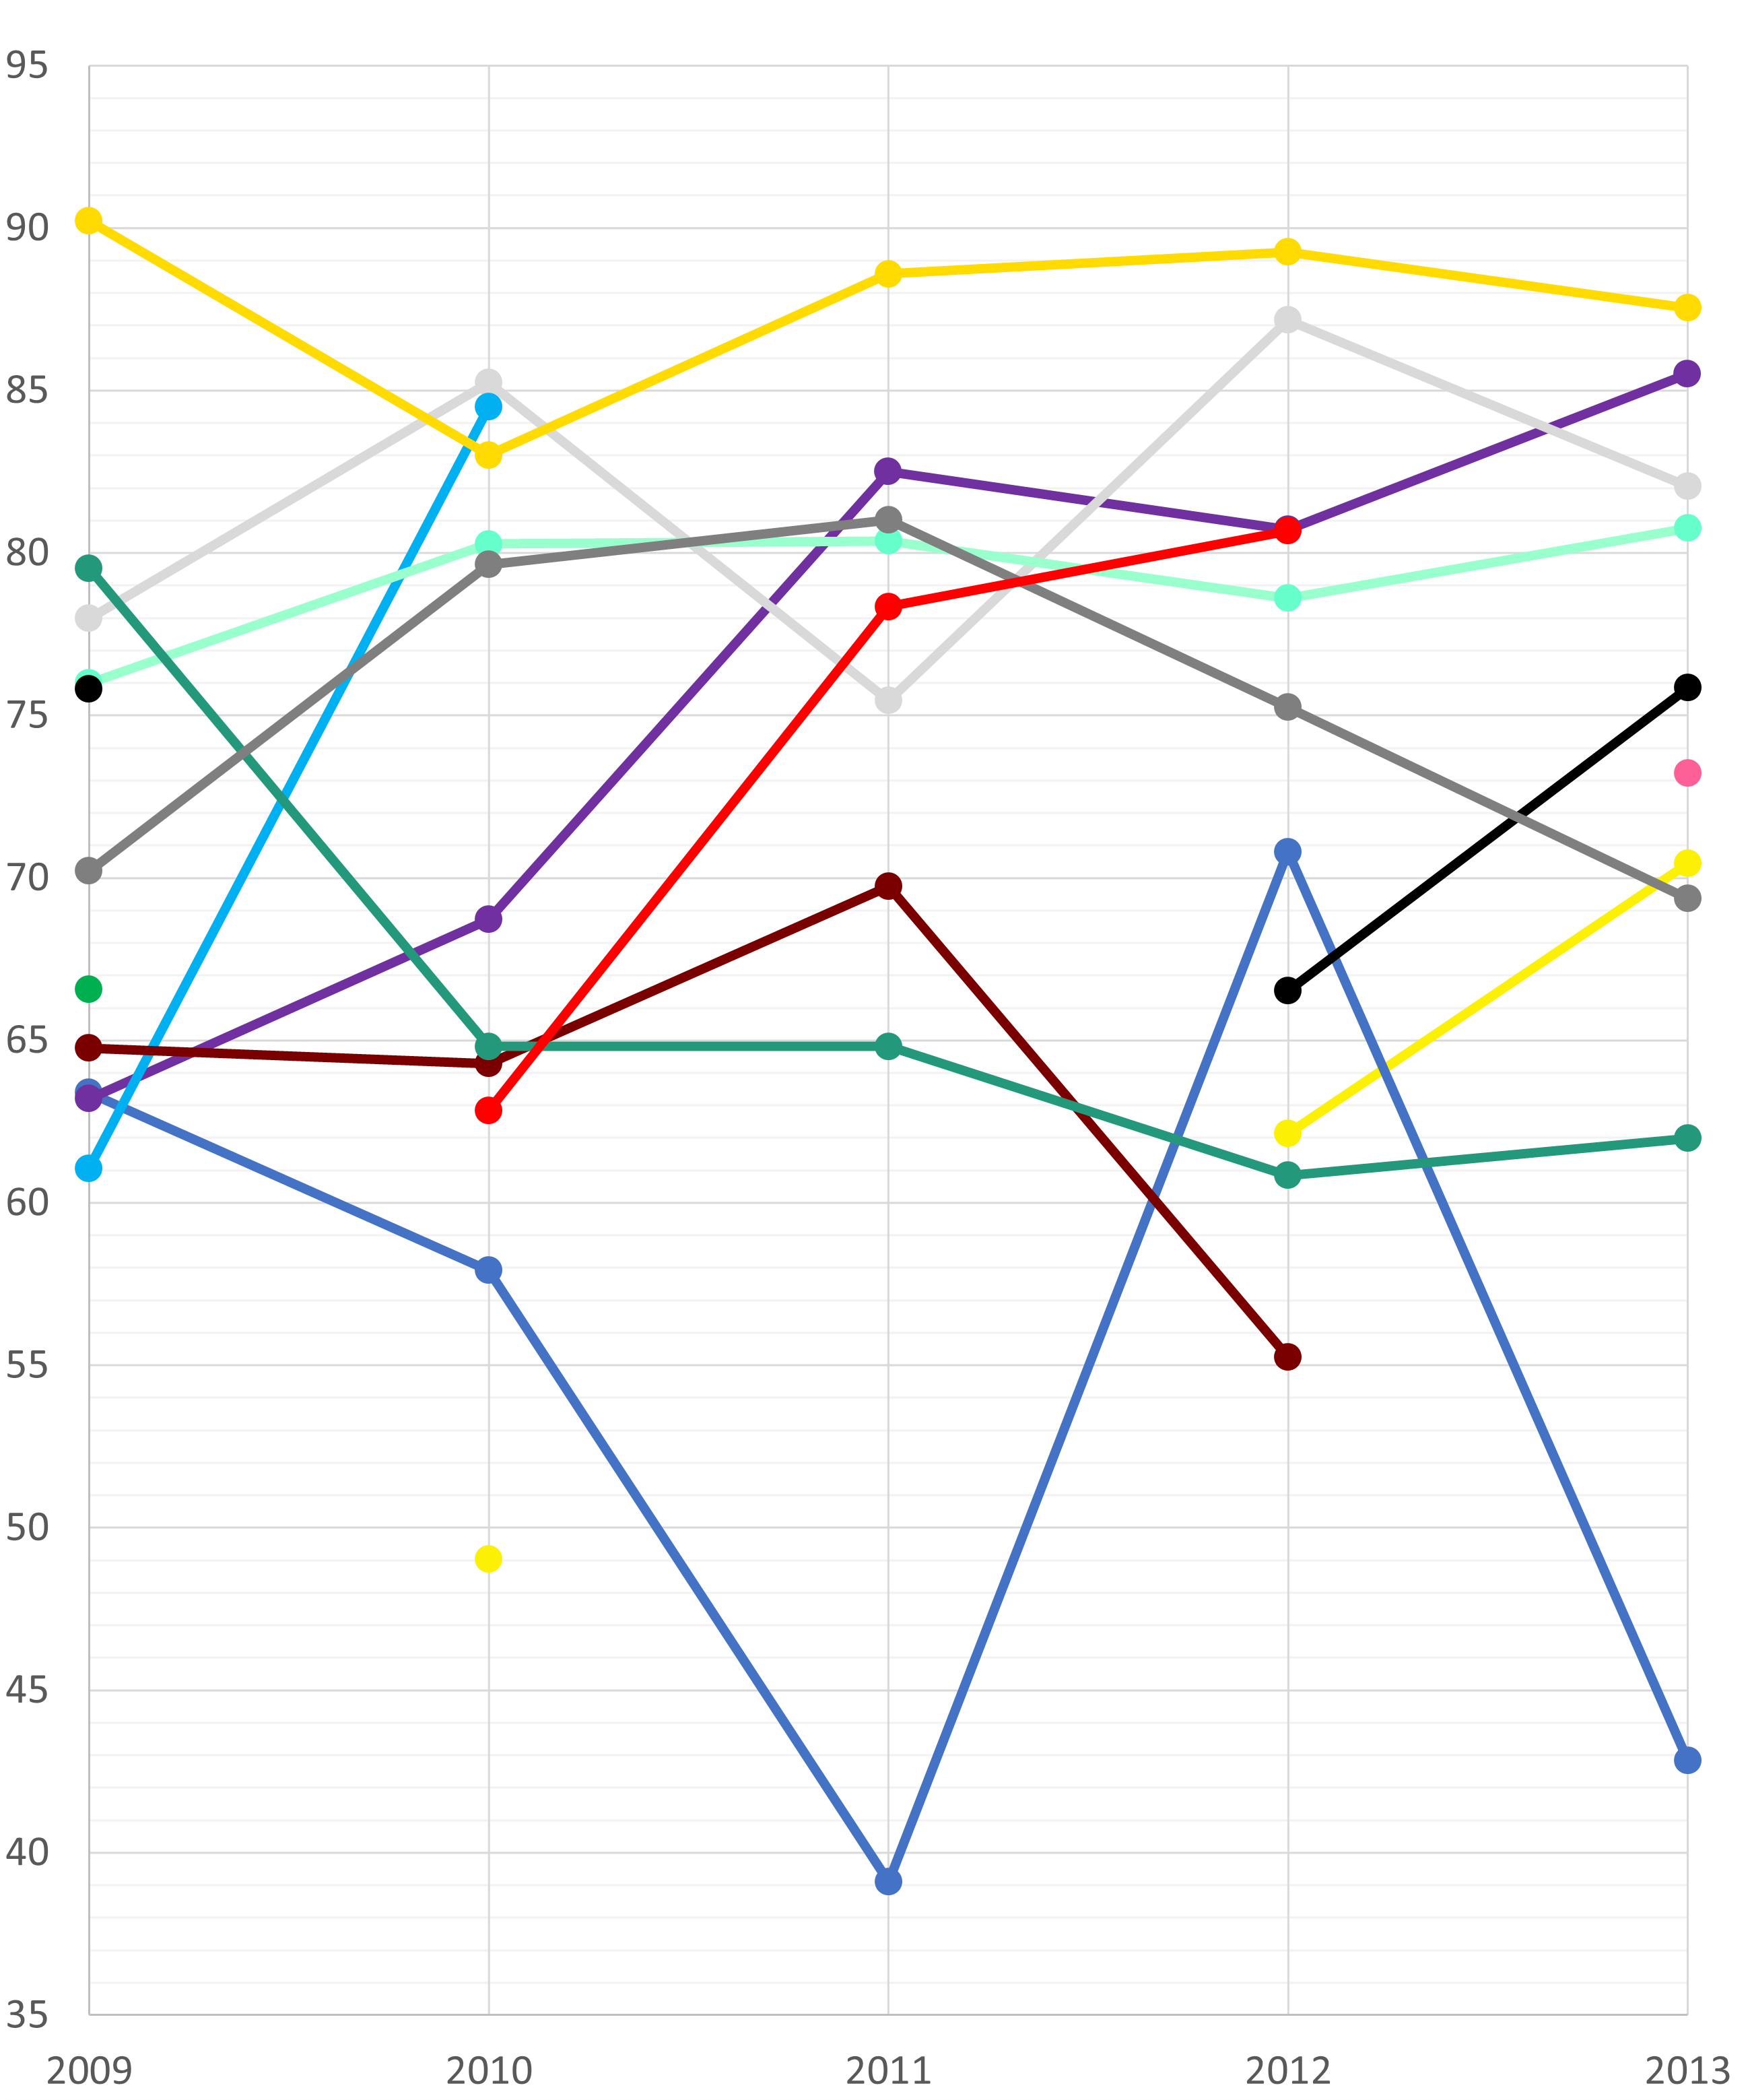
The highest rated season of this era is not Alonso’s 2012, but instead his 2009 with 90.2. In 2012 he scored the 2nd highest rating (89.3). Infact, all of the best seasons belong to Alonso. The only season, he isn’t definetly the best driver is 2010, going to Hamilton instead, with Kubica within uncertainty.
Multiple drivers narrowly or unluckily miss out on scoring above average. Daniel Ricciardo scored 70.0 in 2013, but his previous seasons were not good enough. His overall rating for the era is 61.4. The same goes for his Toro Rosso predecessors Buemi and especially Alguersuari. Both Trulli and Heidfeld score below the threshhold only once, but those seasons (2010 for Heidfeld, 2011 for Trulli) were so terrible that they drag them below the average.
The floor of driver quality was still very low in this era, and produced some terrible performances you won’t see these days. Multiple seasons are rated below 30. The worst full seasons were strung together by Liuzzi in 2010 (27.9), and Nakajima in 2009 (25.2), while the absolute lowest rating goes to Alguersuari for a terrible rookie half-season in 2009 (17.3). However, then there is Kharthikeyan who was so bad that he can’t be properly rated under the difficult circumstances of those uncompetitive cars. While an exact rating is not possible, he is definetly in the single digits.
A Quick Look At The Teams
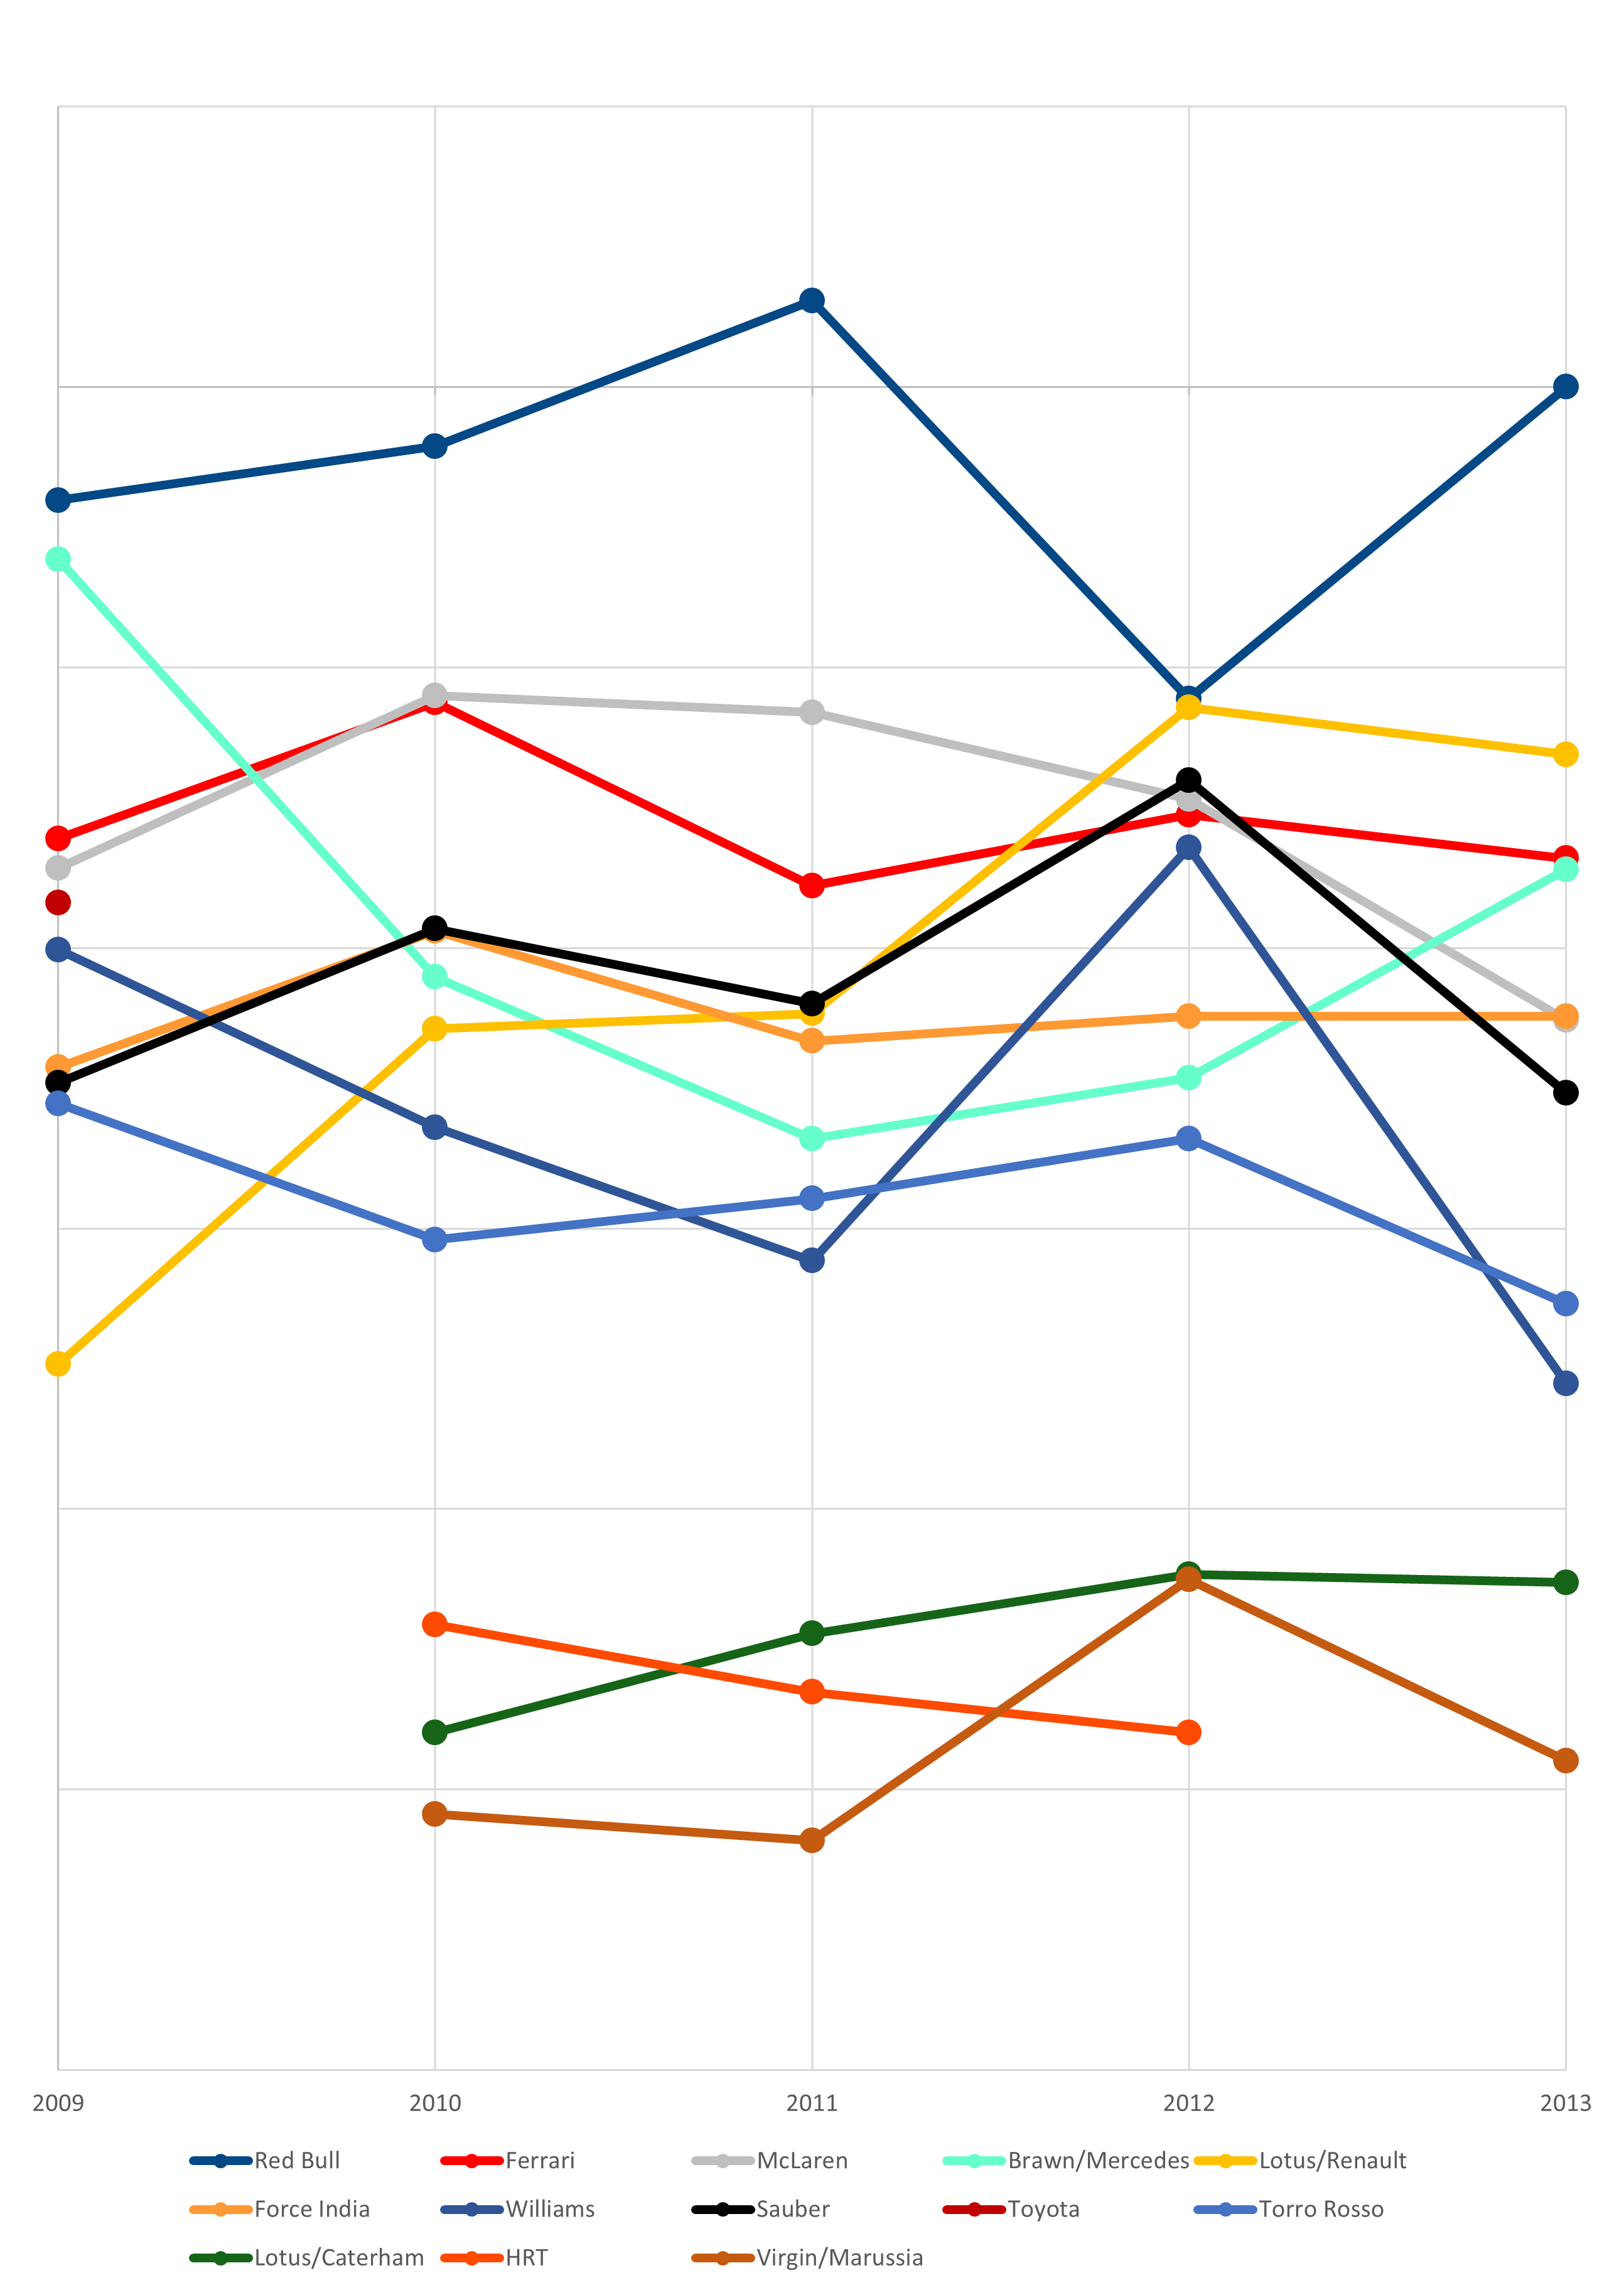
The most interesting season here is 2012. The tire situation created a lot of movement across the grid, and an overall parity unlike the seasons surrounding it. The model would also clearly confirm Alonso’s suspicion, he could have won with a Lotus, seeing as it rates them equal to Red Bull in 2012.
Mercedes is perhaps rated lower than most would have guessed throughout the era, but their line-ups were supreme compared to their rivals (which were not the top teams).
The less said about the new teams, the better…
All of the best driver pairings included Hamilton as he was usually paired with a very capable teammate. Not one of the combinations produced an extraordinary pairing, though:
- 2010 – Hamilton/Button – 82.6
- 2012 – Hamilton/Button – 82.0
- 2013 – Hamilton/Rosberg – 81.4
- 2009 – Alonso/Piquet Jr – 81.3
- 2012 – Schumacher/Rosberg – 79.7
- 2011 – Rosberg/Schumacher – 79.4
- 2012 – Alonso/Massa – 79.1
If you want to support this, please consider leaving a tip
Make a one-time donation
Make a monthly donation
Make a yearly donation
Pick an amount to donate…
…or do what you want
Your contribution is appreciated.
Your contribution is appreciated.
Your contribution is appreciated.

Leave a comment