
2025 delivered an ultra-close championship fight to the last race, and yet, noboby seriously questioned at any point who the best driver was. A new champion was crowned, ending both 16 years of McLaren drought and 16 years of the same 2 teams employing the WDC. However, 2025 also offered some interesting new teammate pairings and a lot of rookies. The mathematical model seeks to eliminate the factor car by only measuring drivers against their teammates.
How Does It Work?
My model was inspired by the amazing f1metrics model and therefore shares a significant portion of its methodology.
Step 1 was to introduce a unified points system. P1 gets 10p, P2 gets 10p*0.72=7.2p, P3 gets 7.2p*0.72=5.18p …. etc. all the way to P20. Driver related DNFs are scored with 0p.
Then the 2 teammates get their points assigned for every race. Races where one driver has mechanical issues are excluded (or corrected if possible). Driver errors and other incidents are also excluded (or corrected if possible). Now the points are tallied up and converted on an s-curve. The difference between the two values of the drivers is the performance difference between them.
In combination with functions for age and experience (I use those of the f1metrics model), doing this with all drivers over a lot of seasons, results in a pretty sturdy web of relative driver performances. While building this web, I am not looking for a compromise of all seasons but instead a most perfect fit.
Season Ratings
Now that I have performance ratings (later referred to as ceiling/pace/potential) for the drivers, I can get a value for the car/team in a season since
(points)=(driver performance)+(car performance)
and therefore
(car performance)=(points)-(driver performance)
The driver errors are then added back in, giving a new points total, and through
(points)-(car performance)=(driver performance)
I get the actual performance of the drivers in that season. Those performance ratings are then translated back over the s-curve to give a “points per race rating” which goes from 0-10. That is then multiplied by 10 to get a neat driver score of 0-100.
As you can see, the major difference to the f1metrics model is the handling of driver errors. In my opinion this results in more accurate ratings as the amount of errors a driver makes can vary widely from season to season. Secondly, it has the advantage of untieing teammates in a season. A drivers rating won’t automatically get boosted just because his teammate is having a shocker.
At its core the model is assessing a drivers ability to score points with
(total points)=(possible points)-(lost points)
This can be abstracted onto the drivers. Simplified the drivers’ season ratings can then be understood as
(driver rating)=(driver pace)-(driver mistakes)
To help give some perspective for the ratings I made these tiers:
- S – above 89
- A – above 82
- B – above 73
- C – above 62
- D – above 50
- F – below 50
From going through all the data and seasons, I would say that generally a good season has a score above 73. Keep in mind, though, that there are no real cut lines. Another bit of context is that the median performance usually sits somewhere in the 60s. Over the last couple of years, it has crossed over into the 70s, which is the first time this happened since the 70s.
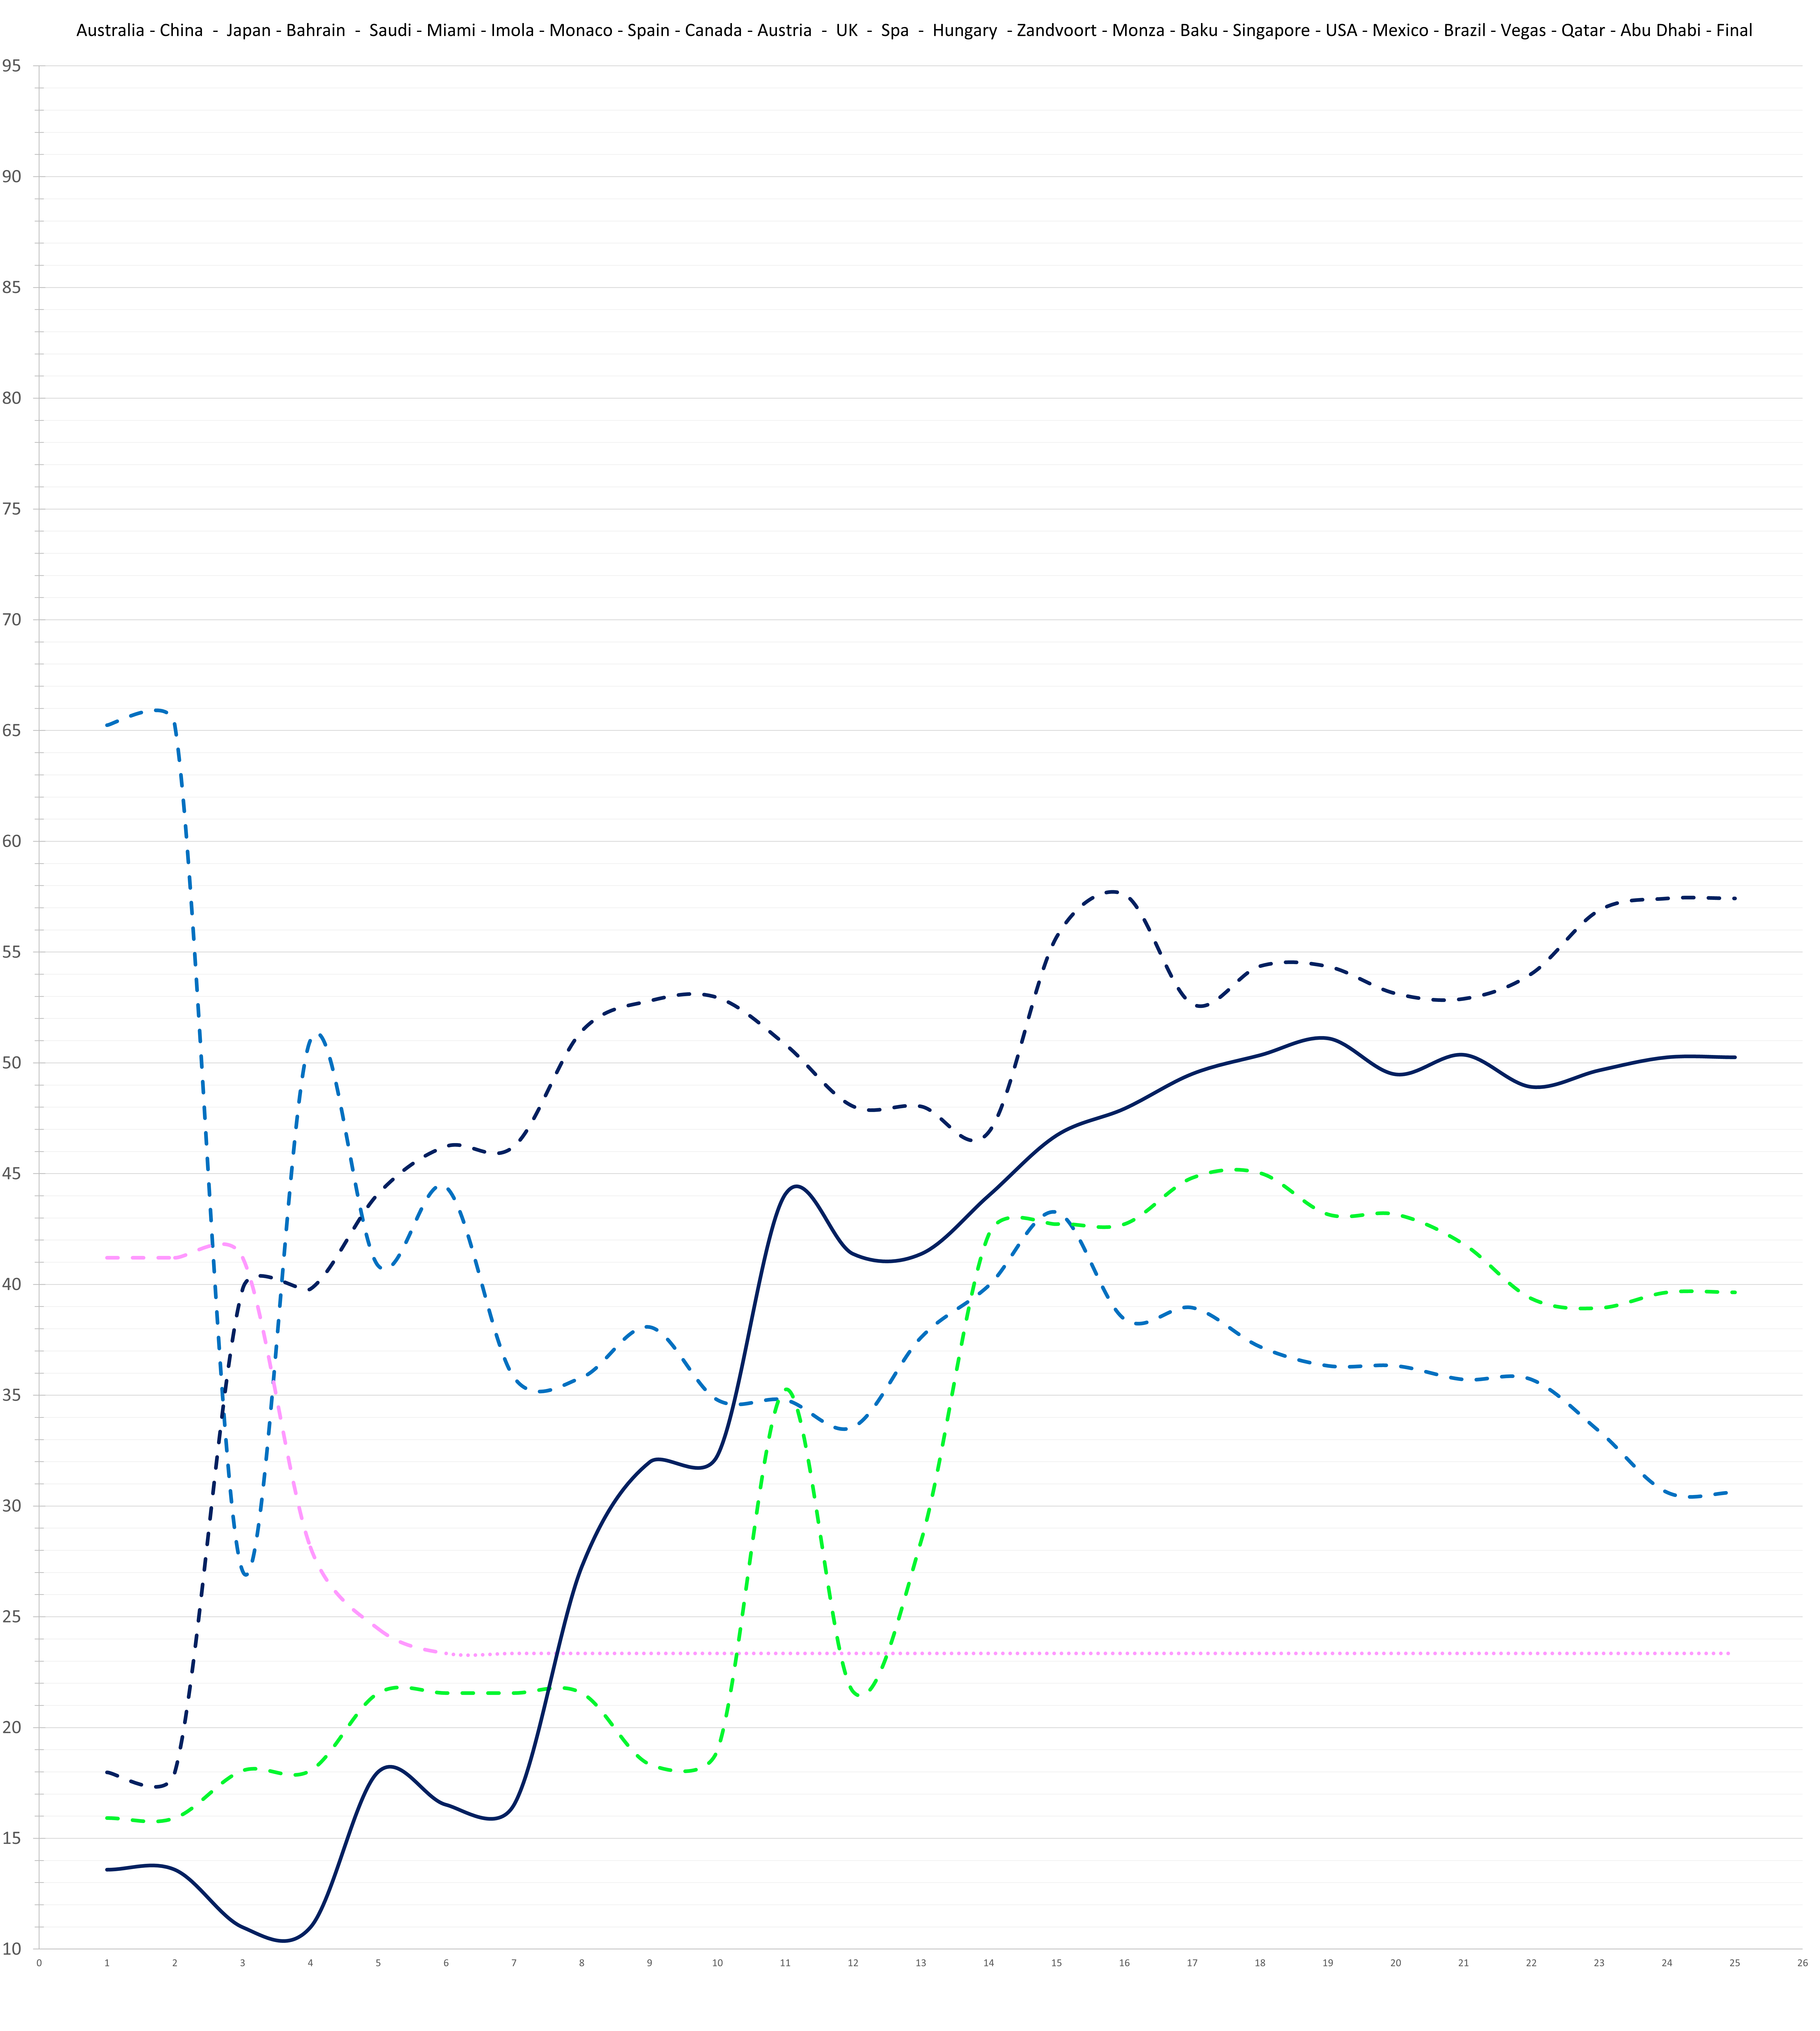
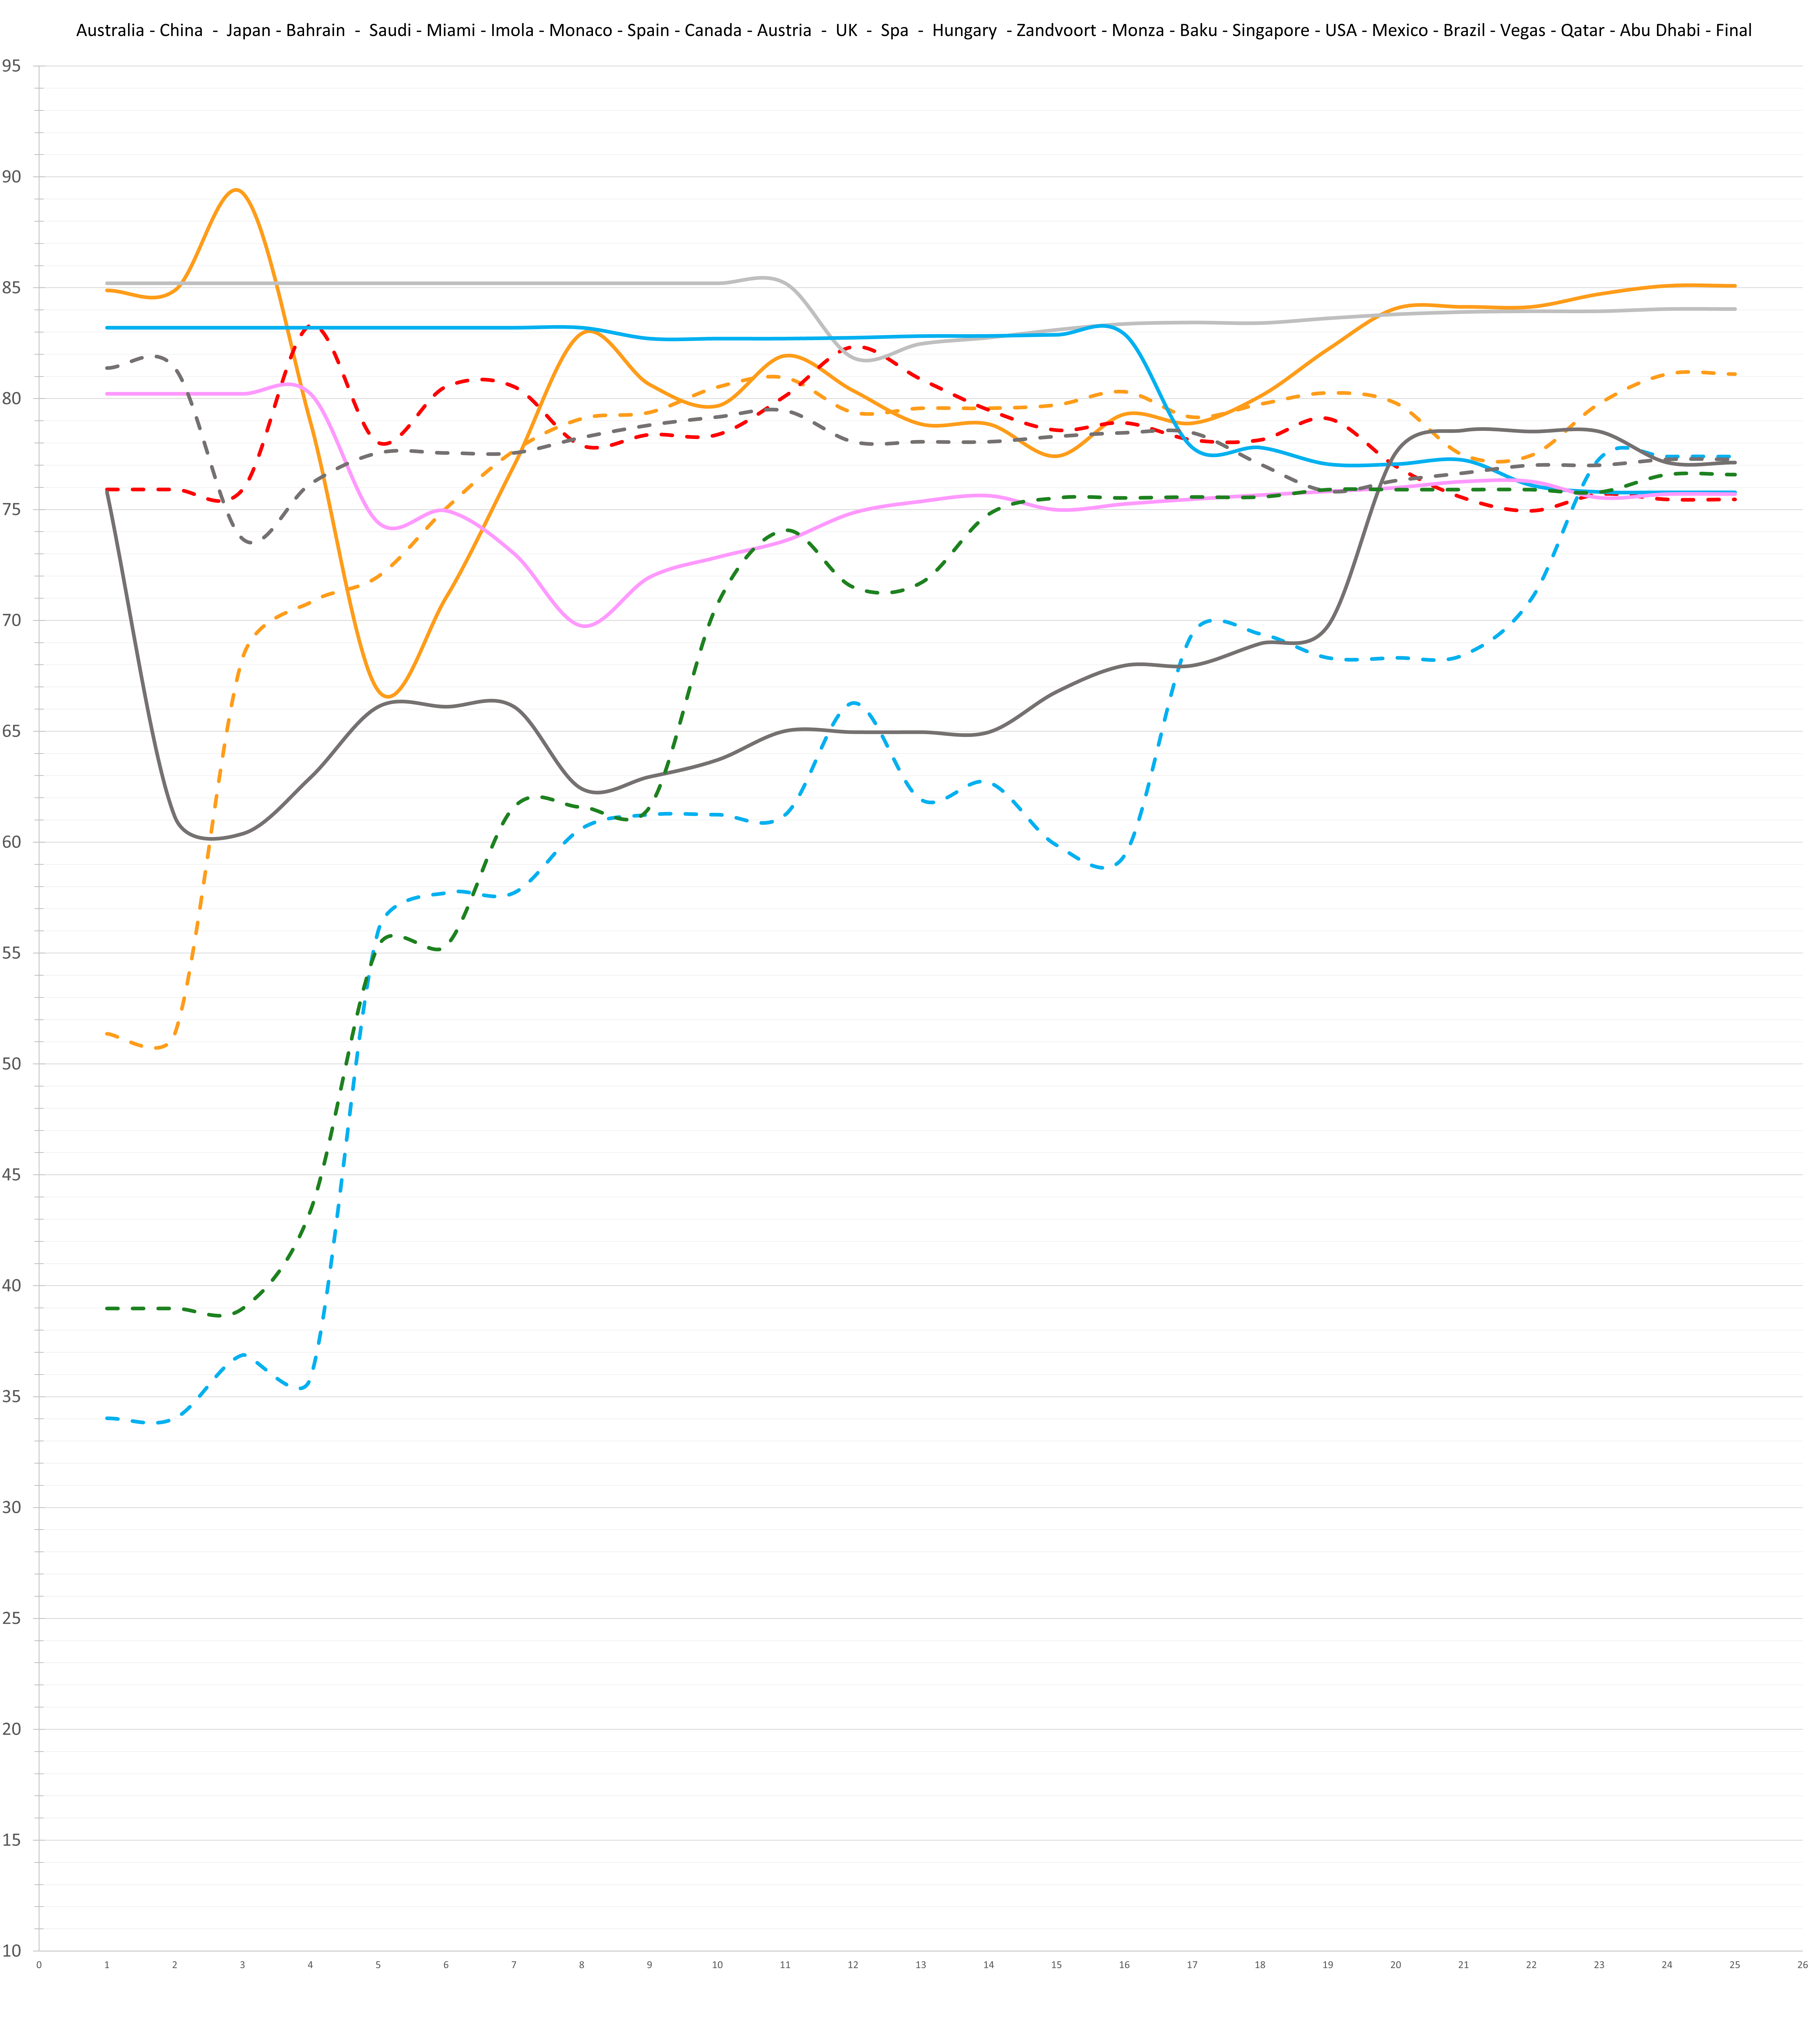
Each driver has their own entry including a graph documenting the change of their season rating through the races, a short summary and of course the actual rating. Behind the rating (in parentheses) you’ll find the drivers expected baseline rating for the 2025 season. It roughly equates to pace and can be understood as a ceiling (only for this season since this value moves with age and experience). It gives you a better understanding and context for the actual driver rating in terms of underperformance, mistakes, consistency, speed etc.
The “Rookies and Yukis”
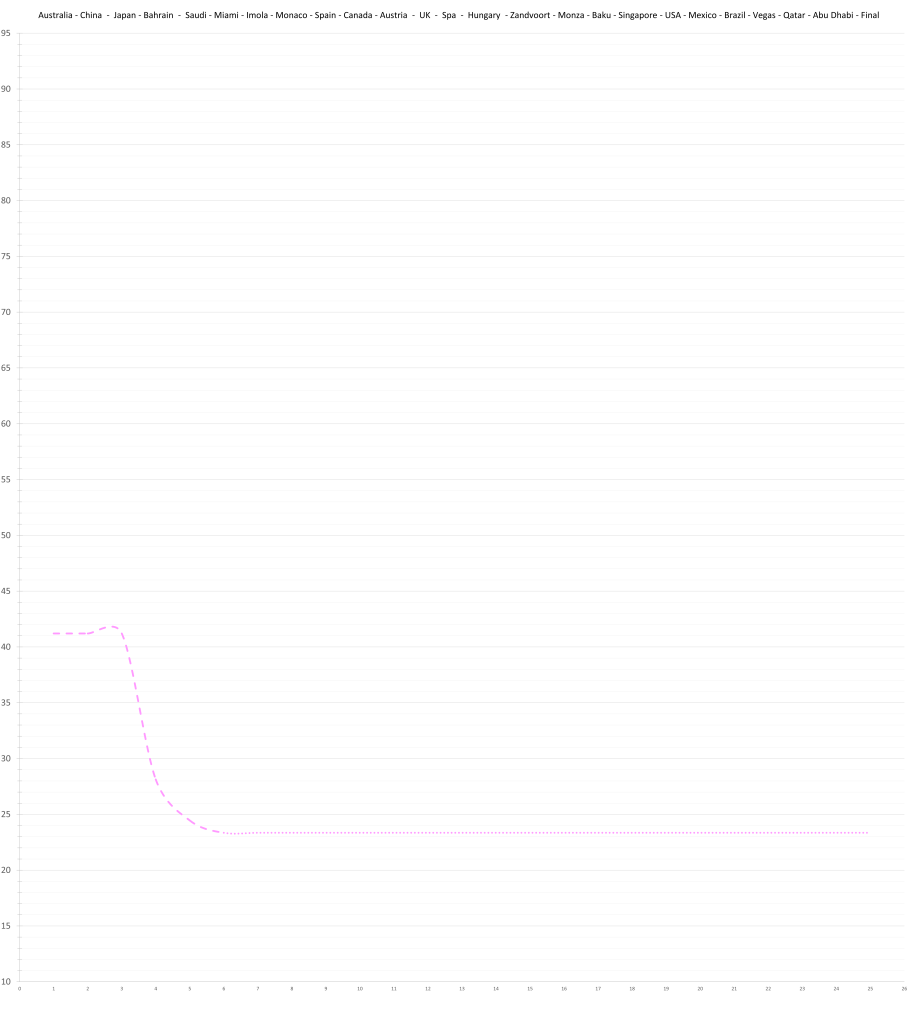
21 – Jack Doohan – 23.3 (40.7)

Did Jack Doohan get enough time to be accurately rated? No, but even a generous estimate based on what he did show would not amount to Doohan becoming a good Formula 1 driver. In a very perverse, cut-throat way, his firing was 100% the right call.
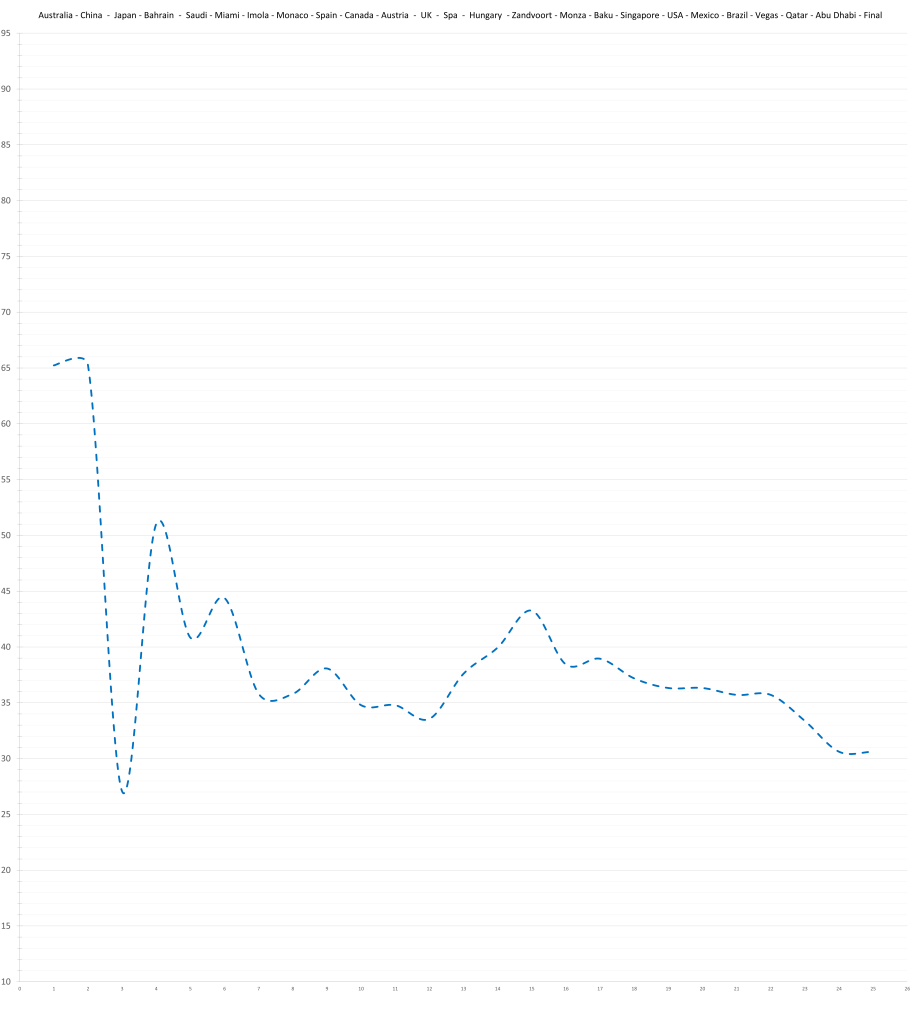
20 – Yuki Tsunoda – 30.6 (78.2)
The Red Bull car definetly seems to be incredibly difficult to drive to it’s limits which diminishes the representativeness of Yuki Tsunoda’s performance, but at the end of the day, he just didn’t do a good job. According to the model, the difference in the expected delta and the actual delta between Verstappen and his teammates grew every year over this cycle of regulations; Tsunoda’s actual delta puts his pace around 38. This hints at Red Bull possibly getting stuck into a particular direction with the car and having to go further and further in that general direction to increase performance without taking a massive step back. For Hadjar’s sake one would hope that the regulation reset enables them to wipe that slate clean.
19 – Gabriel Bortoleto – 39.6 (61.1)
While Gabriel Bortoleto was competitive with Hulkenberg on Saturdays, he was genuinely lacking on Sundays. Add to that some mistakes and a portion of bad luck, and you get an abysmal rating. Where exactly his ceiling will be is still very unclear but it doesn’t seem likely to be amongst the greats. At best, he could be close to Sainz, at worst, it currently looks like he would have a ceiling like Hulkenberg. That means, he’ll presumably be a good driver, no more, no less.

18 – Liam Lawson – 50.3 (61.7)
Liam Lawson actually doesn’t have a ceiling in the model because he doesn’t have two data points supporting the same trajectory yet. With his teammate, Hadjar, being a rookie and therefore not having a ceiling either, the two of them can’t really be rated by the model. This is an estimate based on the coservative delta between him and Tsunoda in 2024 which is already only accounting for a handful of races.
17 – Isack Hadjar – 57.4 (64.0)

Since neither Lawson nor Hadjar have a ceiling yet (as two matching data points are required), Isack Hadjar really has no rating. However, this is the best estimate.
The “So-So Squad”
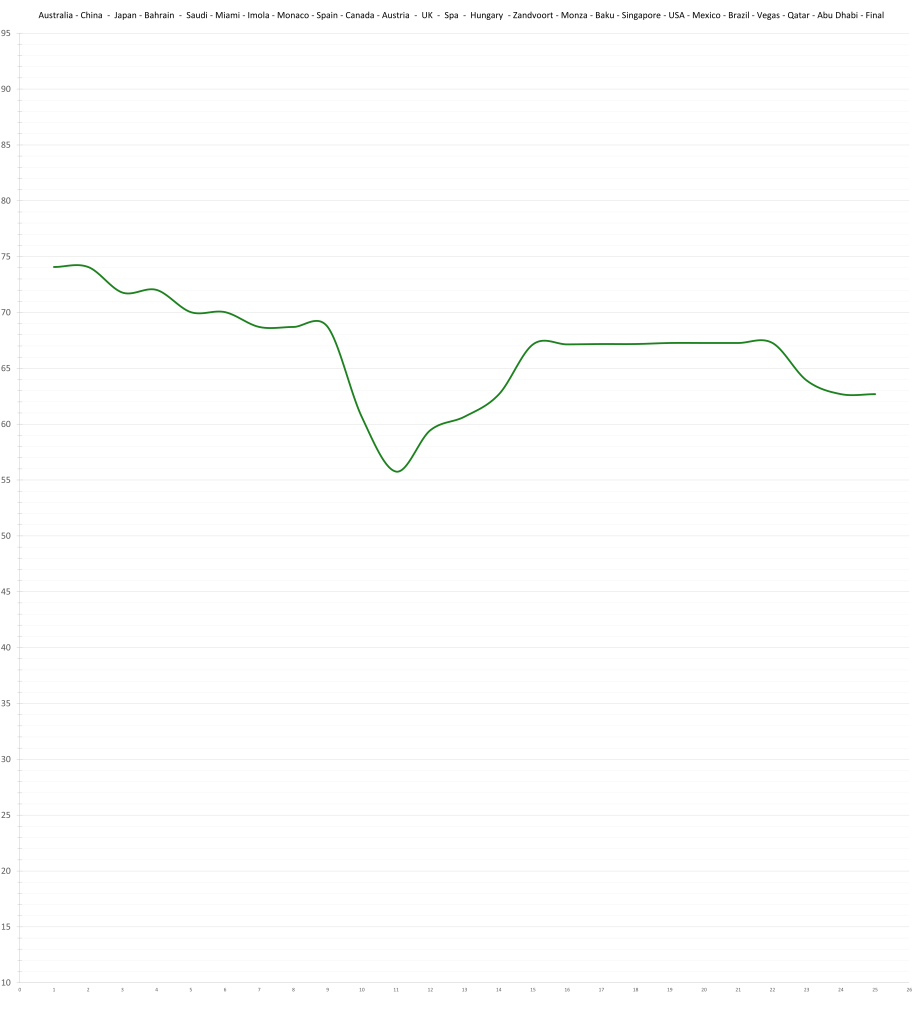
16 – Lance Stroll – 62.7 (74.1)
According to the model, Lance Stroll underperformed; his delta to Alonso is larger than expected, which might be due to his wrist issue flaring up again during the first half of the season. However, his rating is just as “good” as it has been in the previous seasons due to being there when it matters often enough.
15 – Franco Colapinto – 64.5 (66.3)
Franco Colapinto did fine. He was a very clear improvement over Doohan, but more data is needed to get a good judgement for his level. At the moment, he looks like a future Gasly himself.

14 – Kimi Antonelli – 65.2 (70.1)
While Antonelli did more than decently for most of the season, he also had some lackluster races every now and again. His delta to Russell would not predict him to be “the next Verstappen” as he was sometimes hyped up to be before the season. It looks more like he’ll be somewhere in the “next Norris” to “next Hamilton” range. On the flip side, unless Russell underperformed, Antonelli would still be expected to eventually have a higher ceiling than George (for anyone wondering who would make room for Max Verstappen if that ever happens). The crossover point should be all the way in 2028, though.
13 – Nico Hulkenberg – 67.3 (68.5)
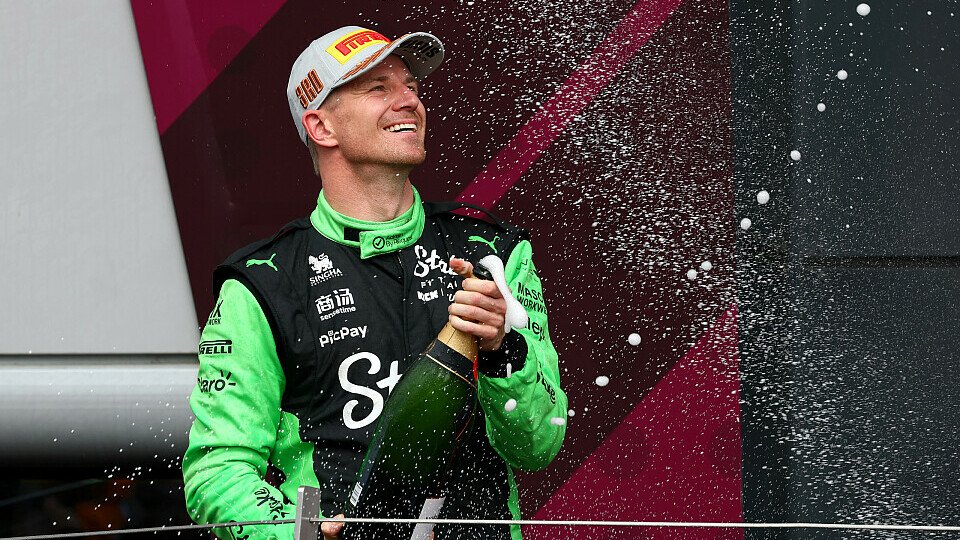
There is a good chance that with further connections to Bortoleto, Hulkenberg’s 2025 rating will dip slightly in the future. What else is there left to say about a 38 year old driver in his 12th season? Hulkenberg has never been a top driver and has not randomly become one at old F1 driver age. But who cares? He was finally on the podium.

The “Good Ones”
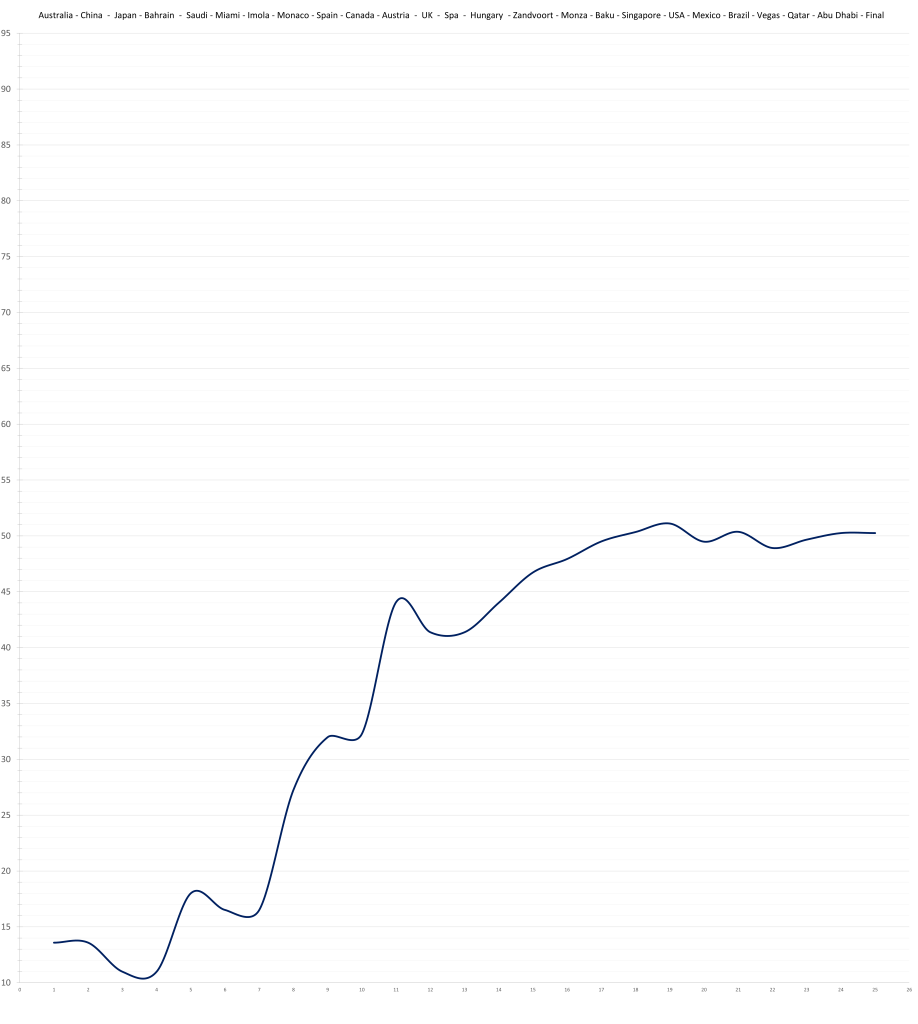
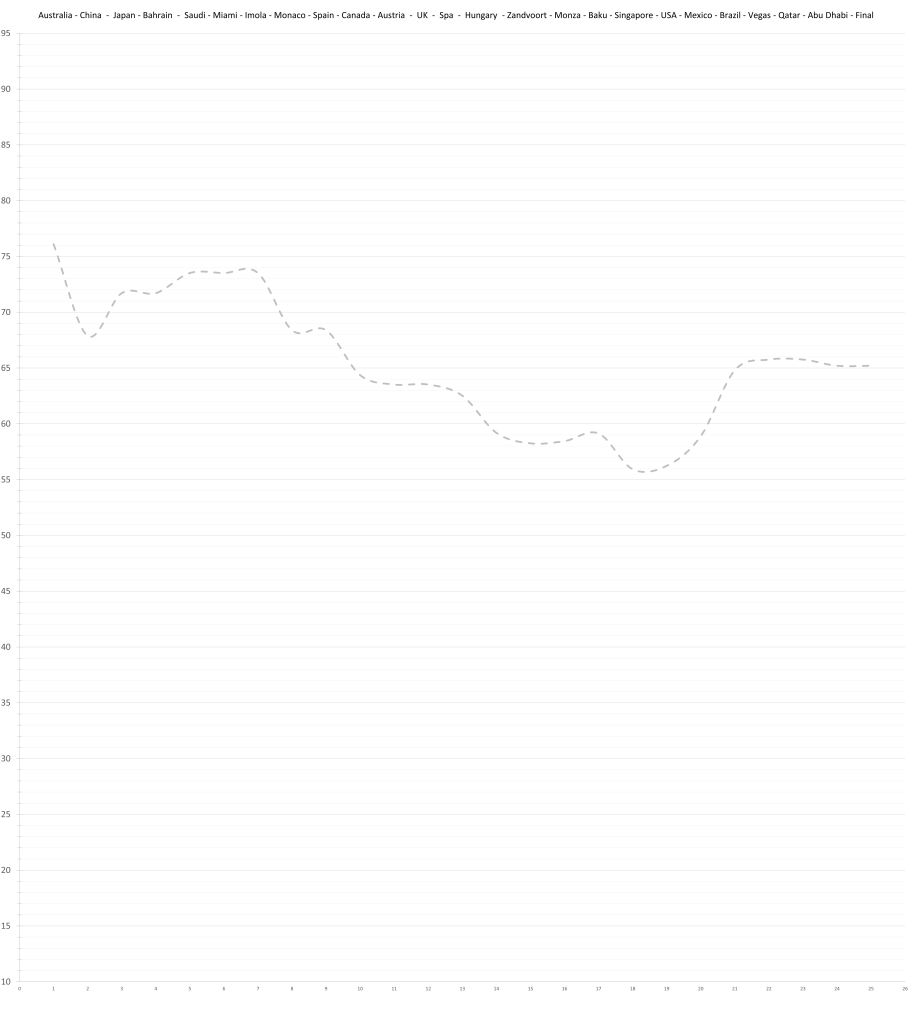
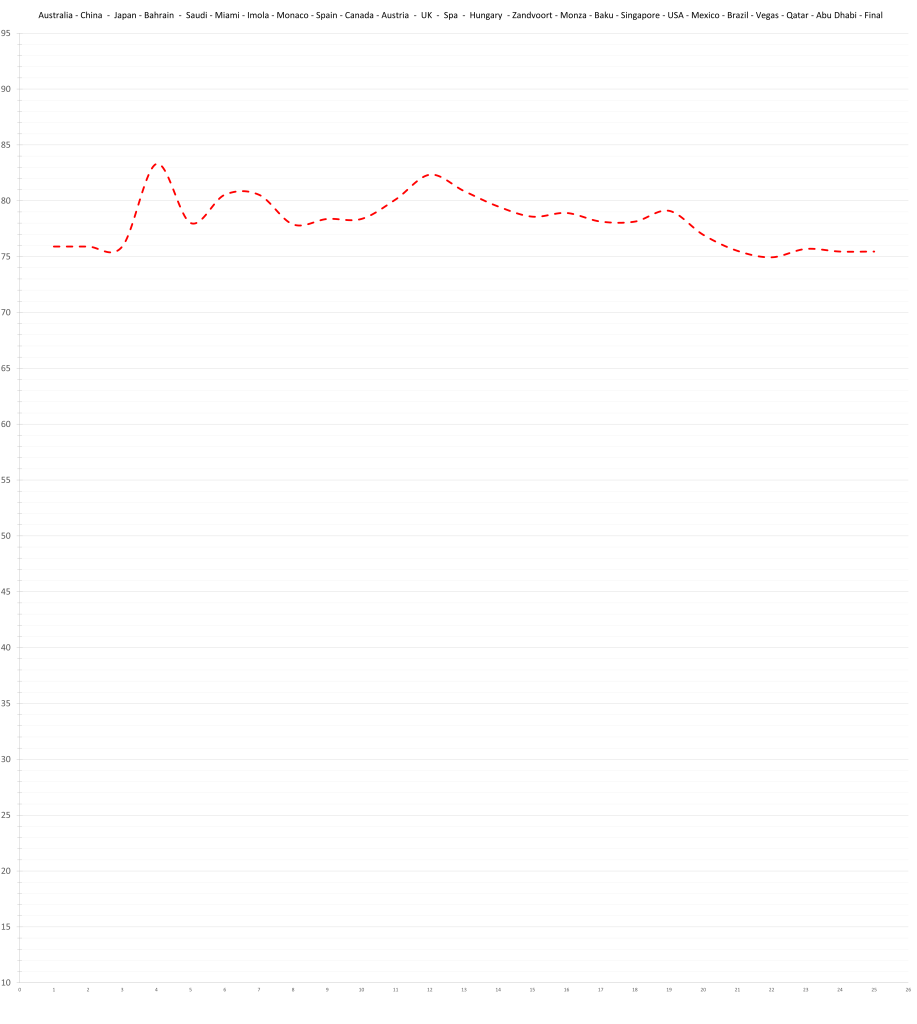
12 – Lewis Hamilton – 75.4 (84.2)
Much has been made of this oh-so-gross underperformance by Lewis Hamilton. “Leclerc has more experience in the team”, “the car doesn’t suit him”, “he can’t get on with ground effect”, or even “2021 broke him” are not rarely heard. None of them really ring true. At most, he struggled slightly with adapting to the car’s characteristics but even then, a visible upwards trajectory is nowhere to be found. The actual answer is “he’s 40”. He was getting on fine in 2022 and 2023, while still steadily declining. The only new thing is costly mistakes in qualifying which started in 2024. Other than that, he is where he was expected to be; just up against an elite driver in his prime. In a way, the 2025 comparison to Leclerc showed what Hamilton has lost compared to his own peak
While not exactly setting the world alight on pace, Hamilton was driving very cleanly through the first half of the season, and consistently hauled in points. His rating mostly bounced around between 5th and 8th, amongst the guys fighting for the championship. Unfortunately, he ended the season on a bit of a low note, finishing in 12th.
11 – Pierre Gasly – 75.7 (80.2)

Piere Gasly did well. No more, no less. At least that’s most likely. His teammates can neither confirm nor deny this rating.
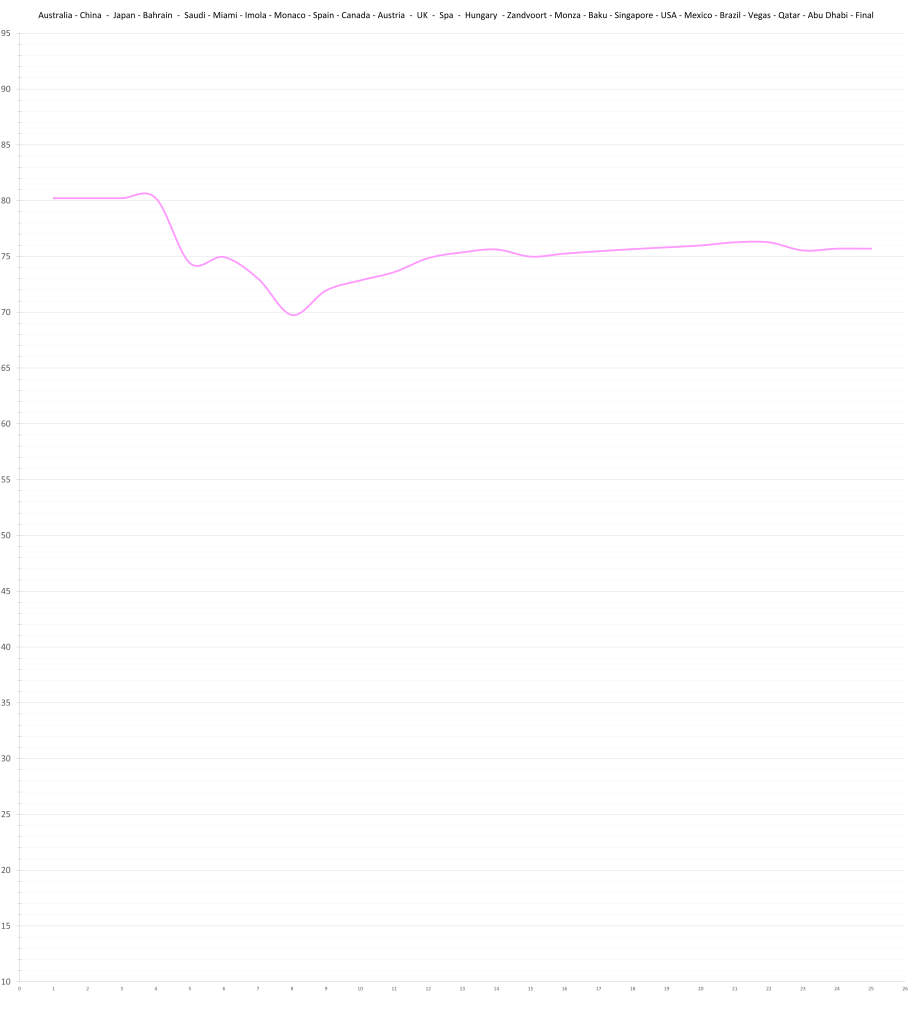
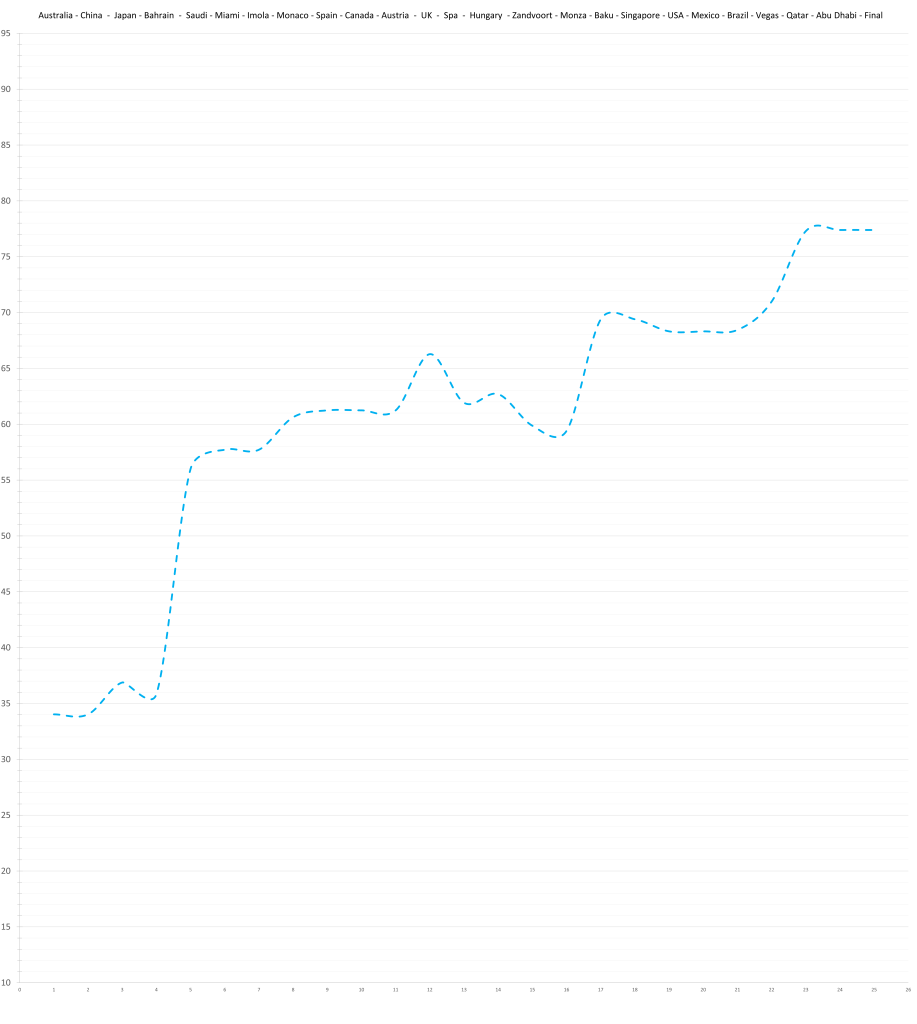
10 – Alex Albon – 75.8 (83.2)
Alex Albon and the terrible, horrible, no good, very bad Autumn: He was having an incredible season before he started to make many costly mistakes, beginning with his consequential crash in qualifying for the Azerbaijan GP. Albon dropped massively from at one point 3rd to his final place in 10th.
However, he did show that he and Carlos Sainz are almost inseperable on pace, and his place within the model has been solidified as a result.
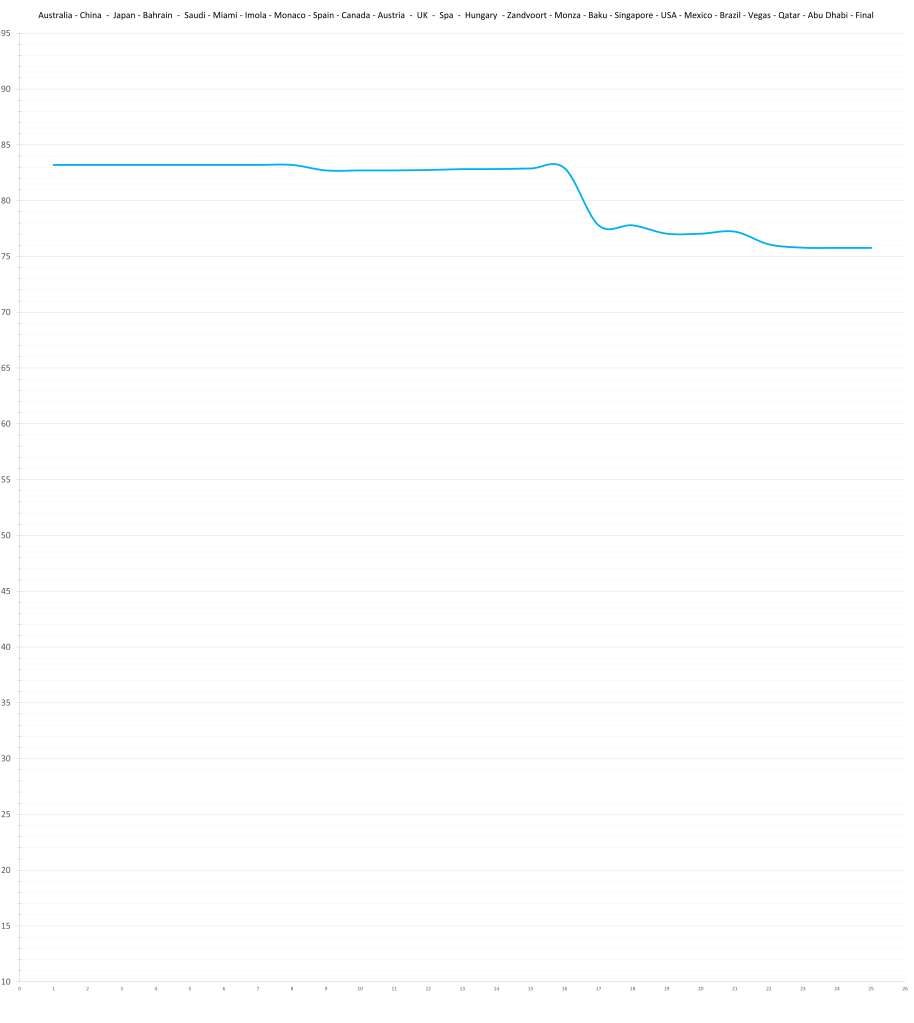
9 – Fernando Alonso – 76.6 (81.4)
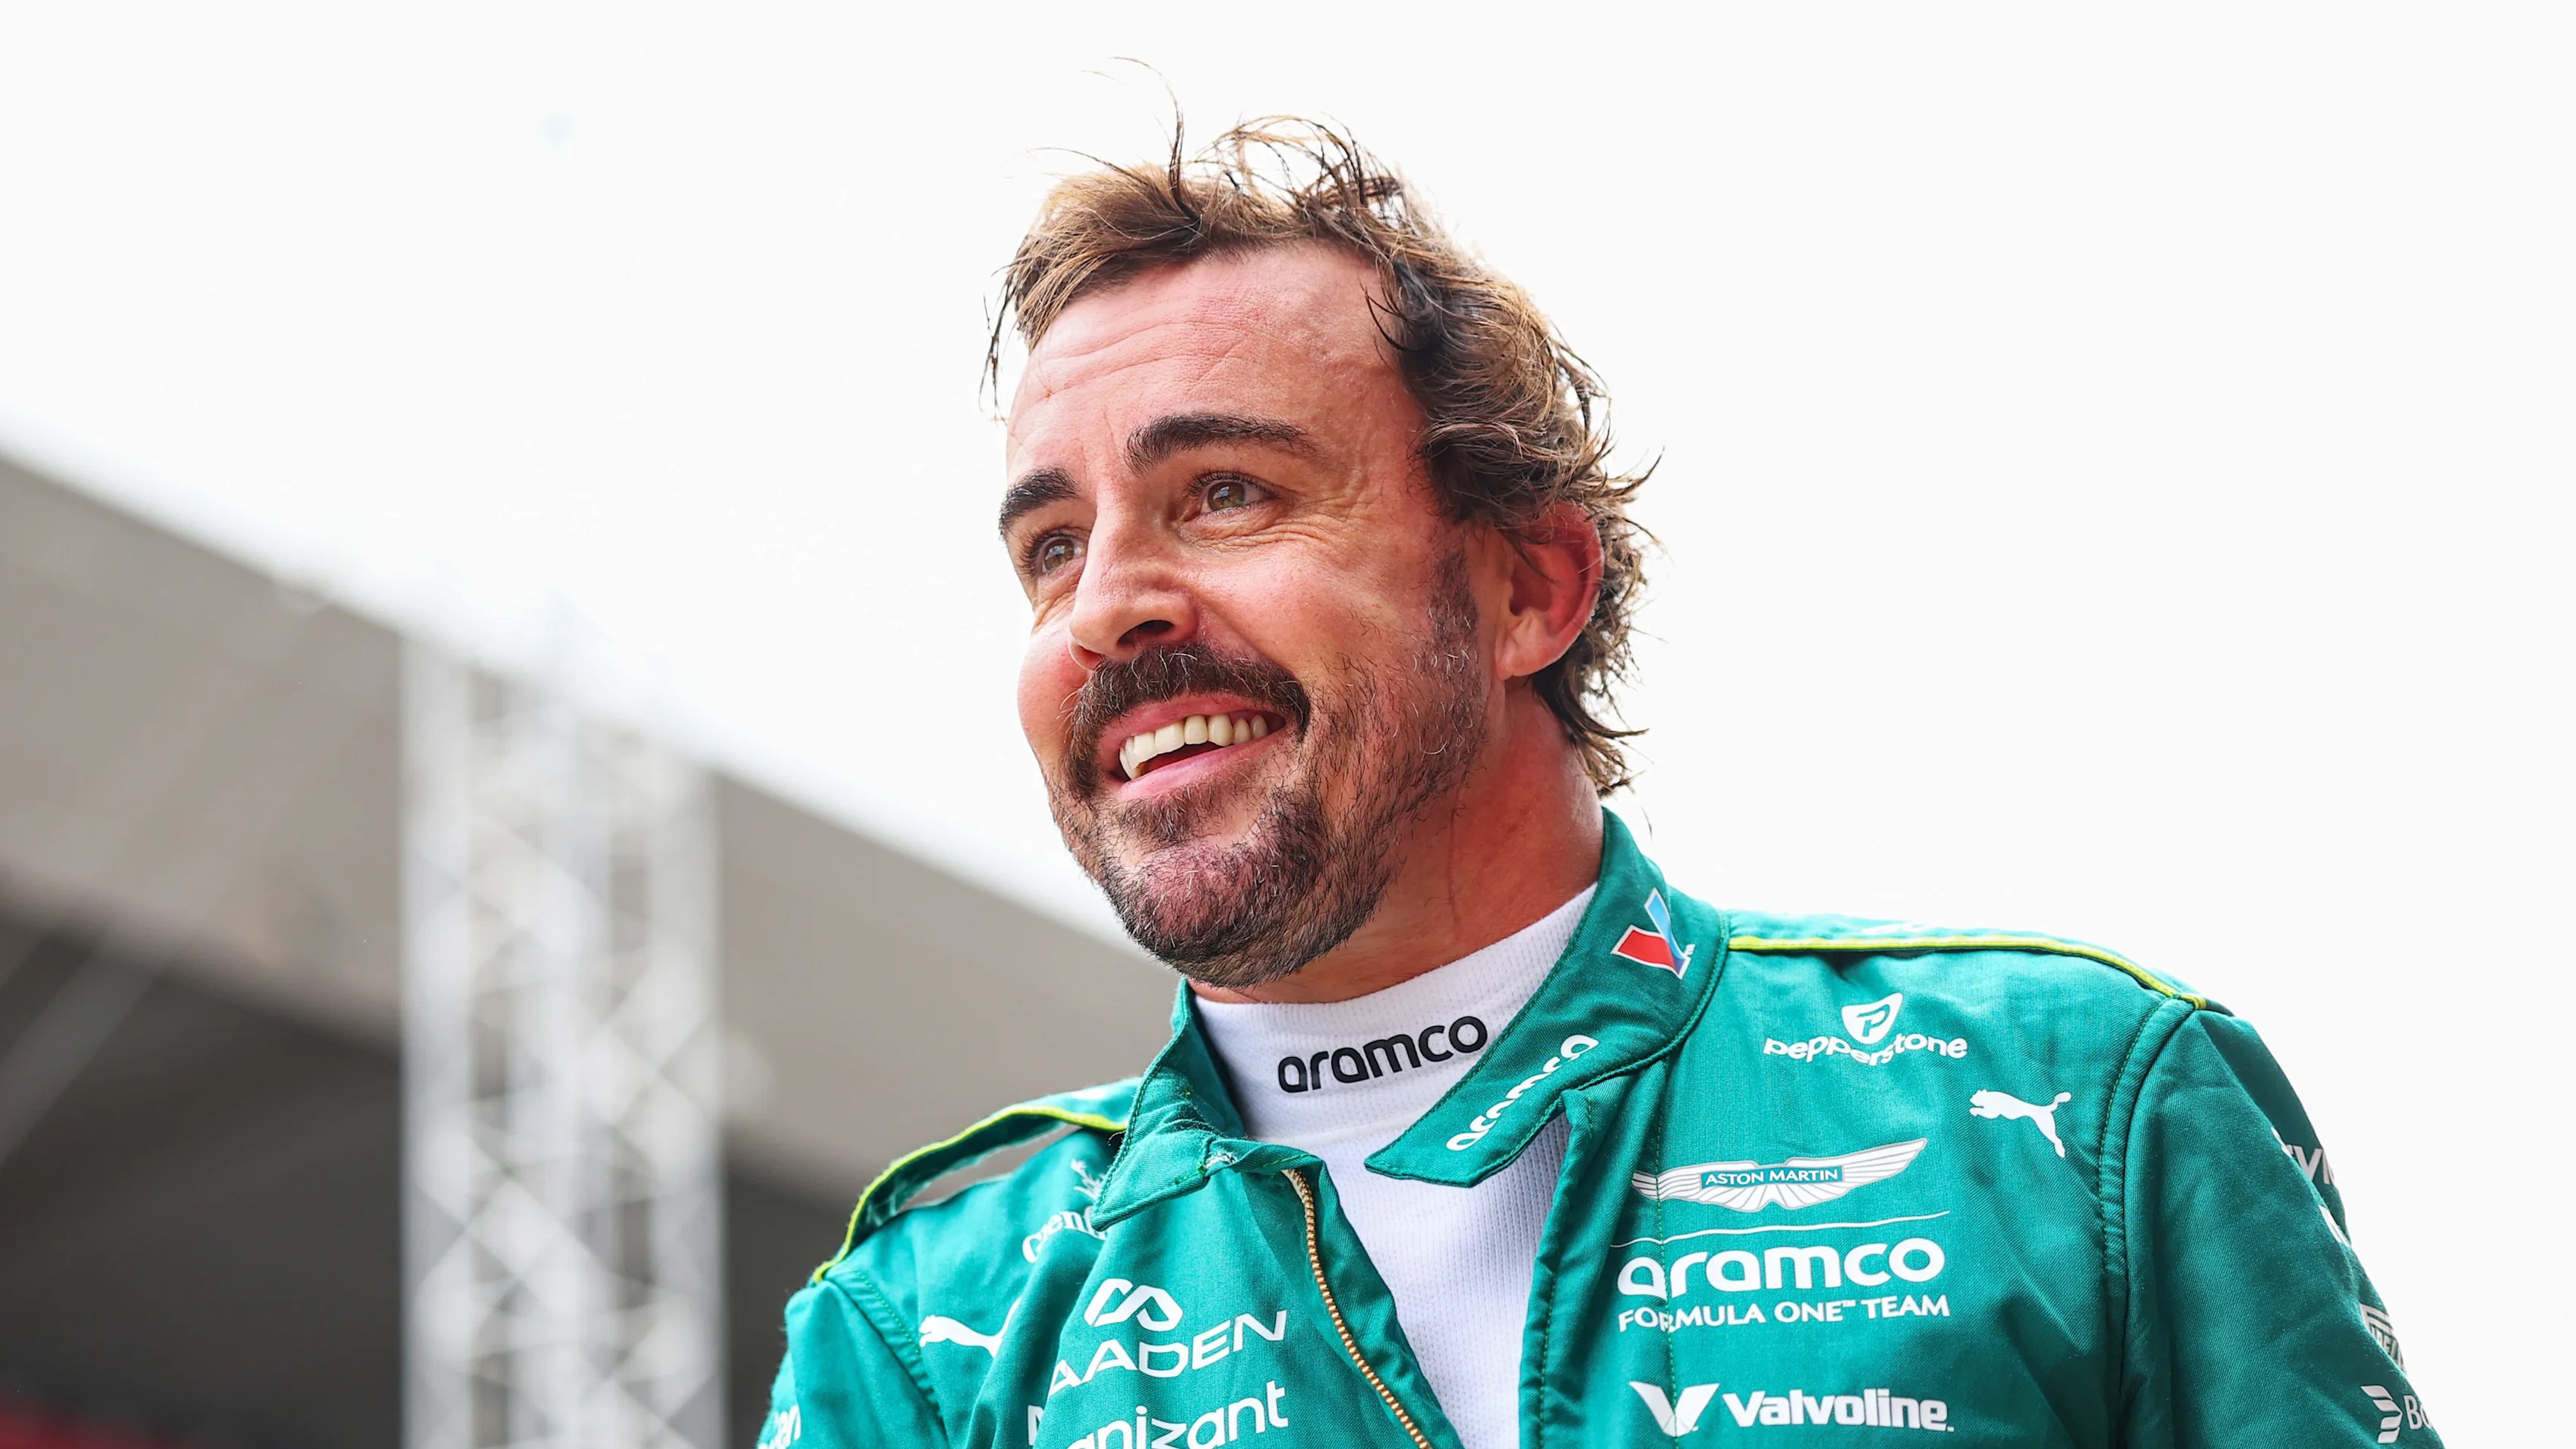
Impressively, Fernando Alonso swept Lance Stroll in qualifying. After crashing to start the season, his rating normalized, and he ended up at a respectable 76.6, of course leaving Stroll far behind him. However, for the first time since 2021, Alonso is not part of the top 5, which, realisticly, won’t change for the better in the future. In 2026, his potential will be down to 79, according to the model, and with the quality of the current grid, he would need a serious car advantage to compete for a championship again.

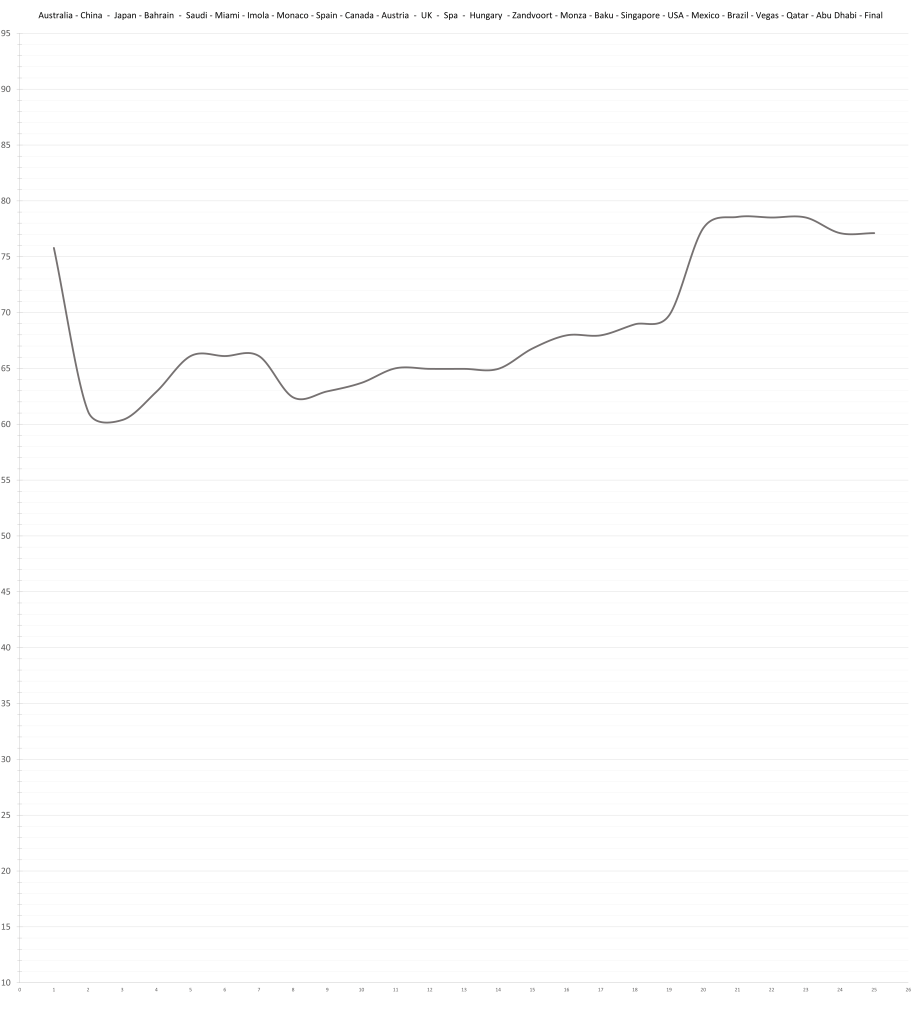
8 – Oliver Bearman – 77.1 (80.6)
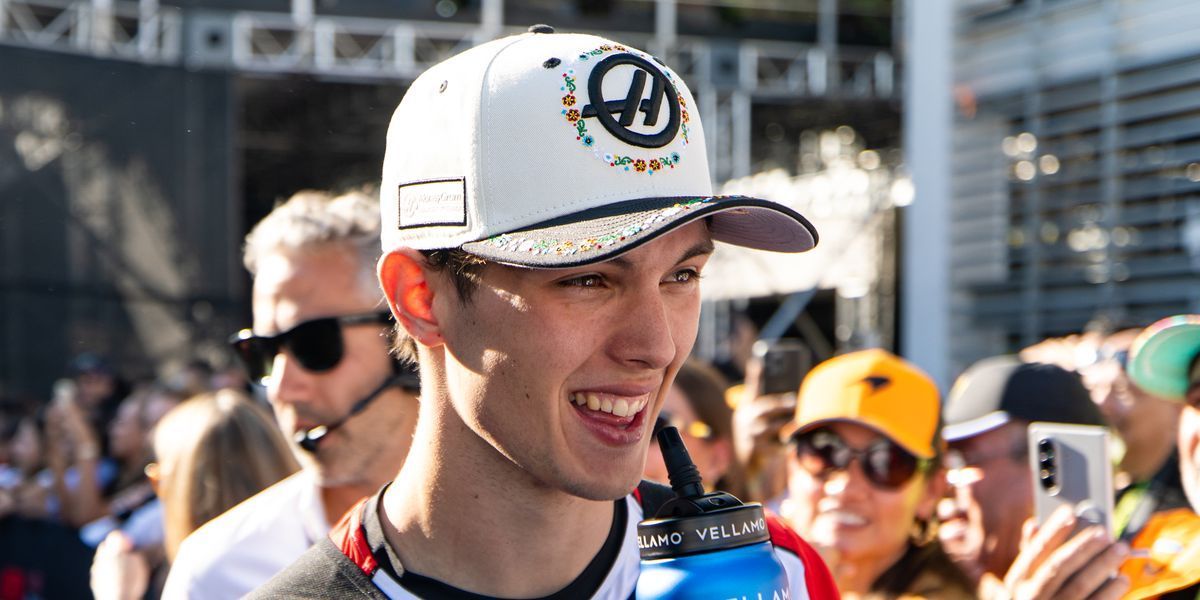
Ollie Bearman started out looking very promising, but now he looks like the next Verstappen, and with a rookie season better than Leclerc, Verstappen, and Hamilton. While that could be true, it might be more sensible to assume that Ocon underperformed this season, until there is more evidence either way. If things keep going like this, he’ll have a direct comparison to Leclerc in no time.
7 – Esteban Ocon – 77.3 (81.4)
As mentioned in Bearman’s entry, Esteban Ocon might not have been as good as this rating suggests, but Bearman’s very high evaluation isn’t the only reason to be suspicious of Ocon’s rating. He is quite the mixed bag for a driver that’s been around for this long.
A major component of what keeps Ocon as high as he is right now are his ’17/’18 seasons. They seemingly clearly place him in comparison to Perez. Now, a few scenarios could be true from the data so far:
- The current one, where Ocon is a potentially very good driver, but a bit inconsistent between seasons, and Alonso came back stronger from his hiatus.
- Ocon is a mediocre driver, Perez underperformed in 2017/2018, and Gasly in 2023, Alonso did not come back stronger, and Stroll was fundamentally weaker after breaking his wrists.
- Ocon is a mediocre driver, Alonso didn’t come back stronger, Gasly underperformed in 2023, Perez became a fundamentally weaker driver starting in 2017, in turn Stroll is a fundamentally weaker driver, and Vettel underperformed in 2022.
All of these have their merits and downsides, and right now the first one seems to be the most coherent way to go, but it’s important to keep these possibilities (and what they entail) in mind. The good thing is that in 2026, Bearman vs. Ocon will give an indication whether or not 2025 was normal, and Perez will be measured against Bottas. Beyond that, Bearman will inevitably get other teammates, and maybe Ocon, Alonso, and Stroll will too. At some point, this will be solved.
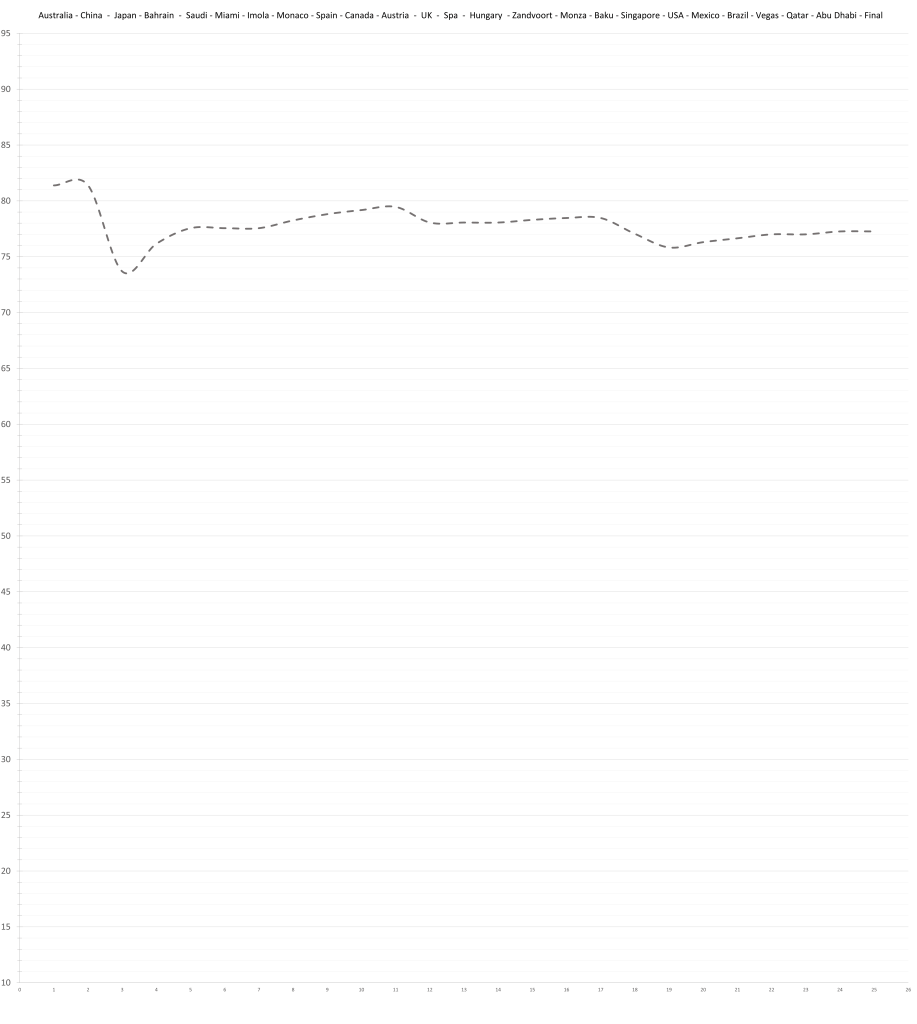
6 – Carlos Sainz – 77.4 (83.2)
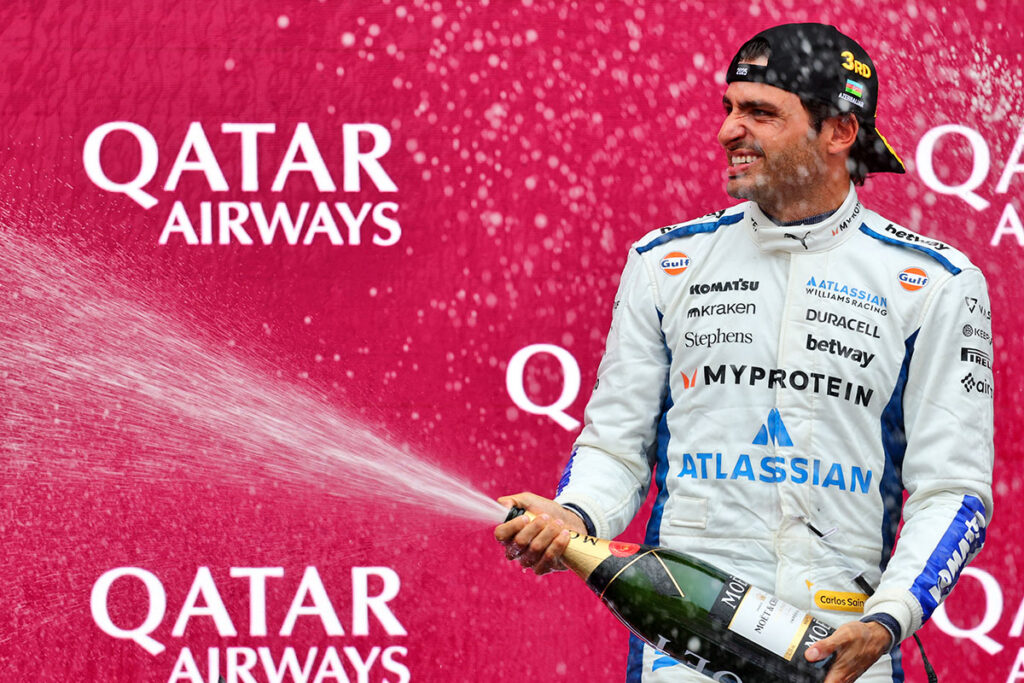
Carlos Sainz did incredibly well to get back into the season the way he did but his mistake strewn first half ultimately prevents 2025 from being among his best seasons. The model expected him and Albon to be equal on pace, and while Williams’ method of flipping a coin before every session to see who gets to have fun makes the comparison more difficult than it needed to be, they eventually ended up with a delta that’s within margin of expectation. The impression that Albon was the clearly better driver in the first half, and Sainz in the second half of the season is true on the surface, but mostly due to mistakes and poor luck. Neither driver was ever far ahead on pace of the other. Sainz has also shown once again what became apparent at Ferrari. He started to lean more and more towards qualifying in his approach to a weekend, and has become a bit of a qualifying specialist.
5 – Oscar Piastri – 81.3 (84.9)
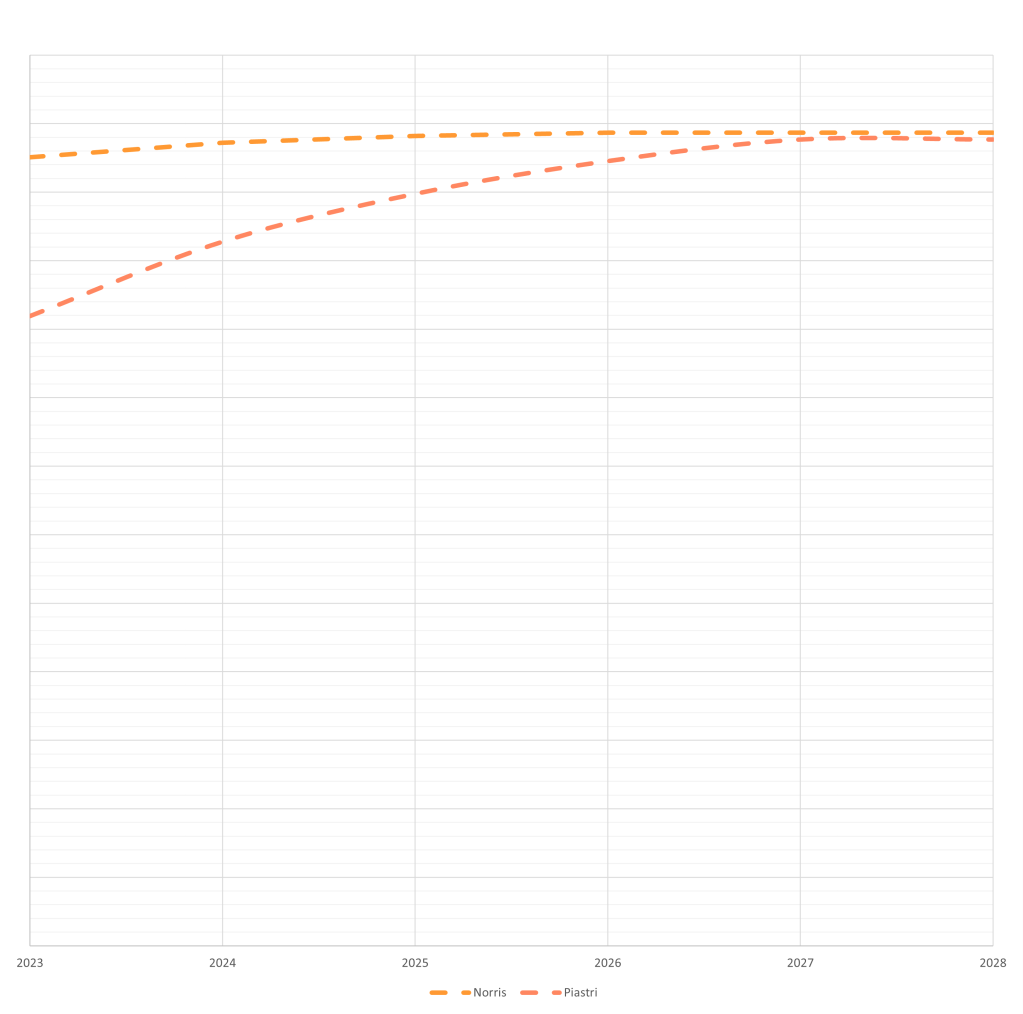
Oscar Piastri and Lando Norris were neck and neck with many swaps until Singapore, where Norris took the reins and never looked back. At the end of the season, the delta between them matched expectations. This indicates that Piastri’s poor form in the second half was not out of the ordinary, but instead somewhat inevitable in comparison to Norris, and with McLaren losing their edge over the competition, it created a bad look. The pattern of his performance dropping towards the end of the season has also been present since his very first year in Formula 1.
Piastri seems to be ahead of Norris in most things not pace, where Lando still enjoyed a sizeable advantage. This advantage will halve to next year (see below), meaning if McLaren can deliver a championship-capable car again, they are probably going to be too close for it to be the differentiator this time.
4 – George Russell – 84.0 (85.2)

George Russell held 3rd place for the vast majority of the season, but it wasn’t meant to be. The model currently holds him as the 4th fastest driver in F1 behind Verstappen, Leclerc, and Norris, but Piastri will likely have overhauled him by next year. He was very consistent across the season (though he is at the mercy of a rookie teammate), with the only notable loss in points coming at Silverstone. As of now, this is his highest rated season, so far, and it’s not only a good season, it’s a great season.

3 – Lando Norris – 85.3 (89.3)

This was honestly worse than it should have been by Lando Norris. Although he made it to third in the end, he should really be a clear with his abilities. Too often did he make a mistake in qualifying and even the races. According to the model, he is the worst champion since… Lewis Hamilton in 2019 and 2020. Yes, Norris’ 2025 was a completely average WDC winning campaign. It ranks at 16/26 in the 21st century, and 27/57 since 1969 for the model. Comparisons to Villeneuve and Hill are frankly ridiculous. To add, the model now sees Lando Norris as McLaren’s 3rd best driver of all time behind only Senna and Prost, but narrowly ahead of Alonso and Hamilton.
As a side note, if you’re wondering how Russell and Norris would compare in the same car. The model suggests that McLaren’s line-up was a pretty close simulation (if Piastri were mostly errorless), because it rates Piastri’s and Russell’s potential in 2025 as virtually identical.

The “All-Timers”
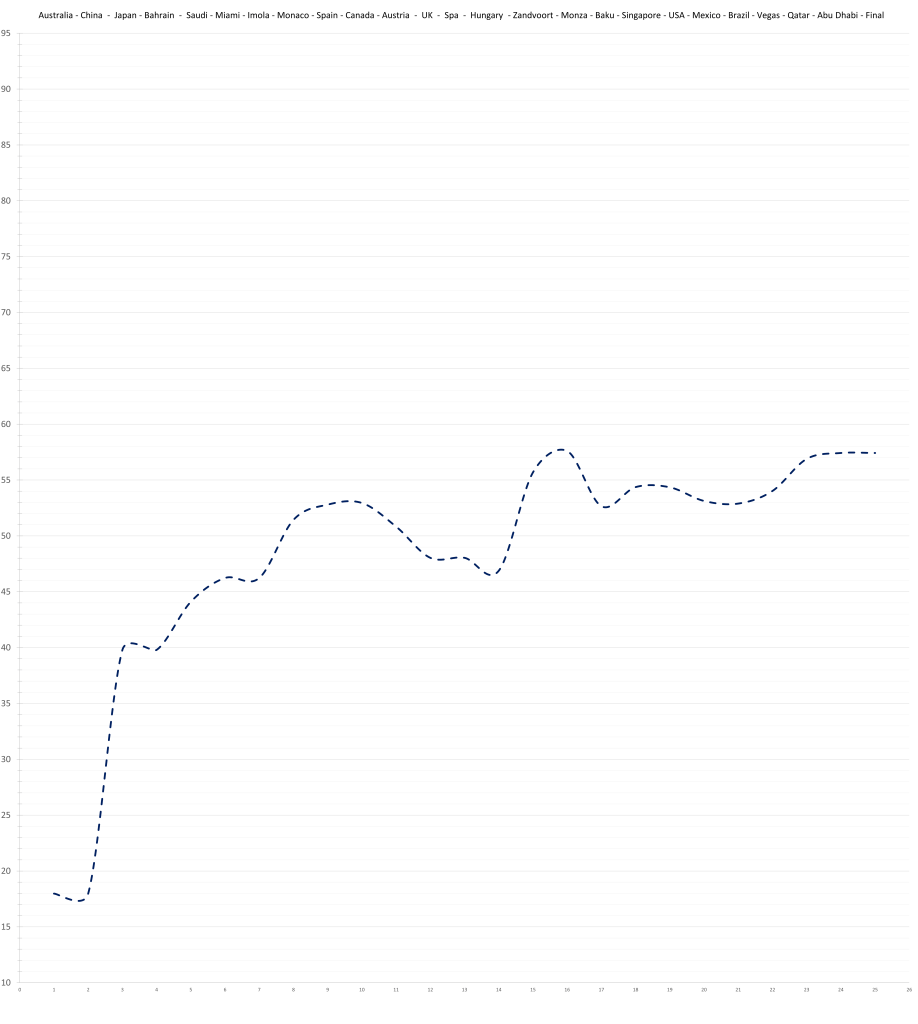
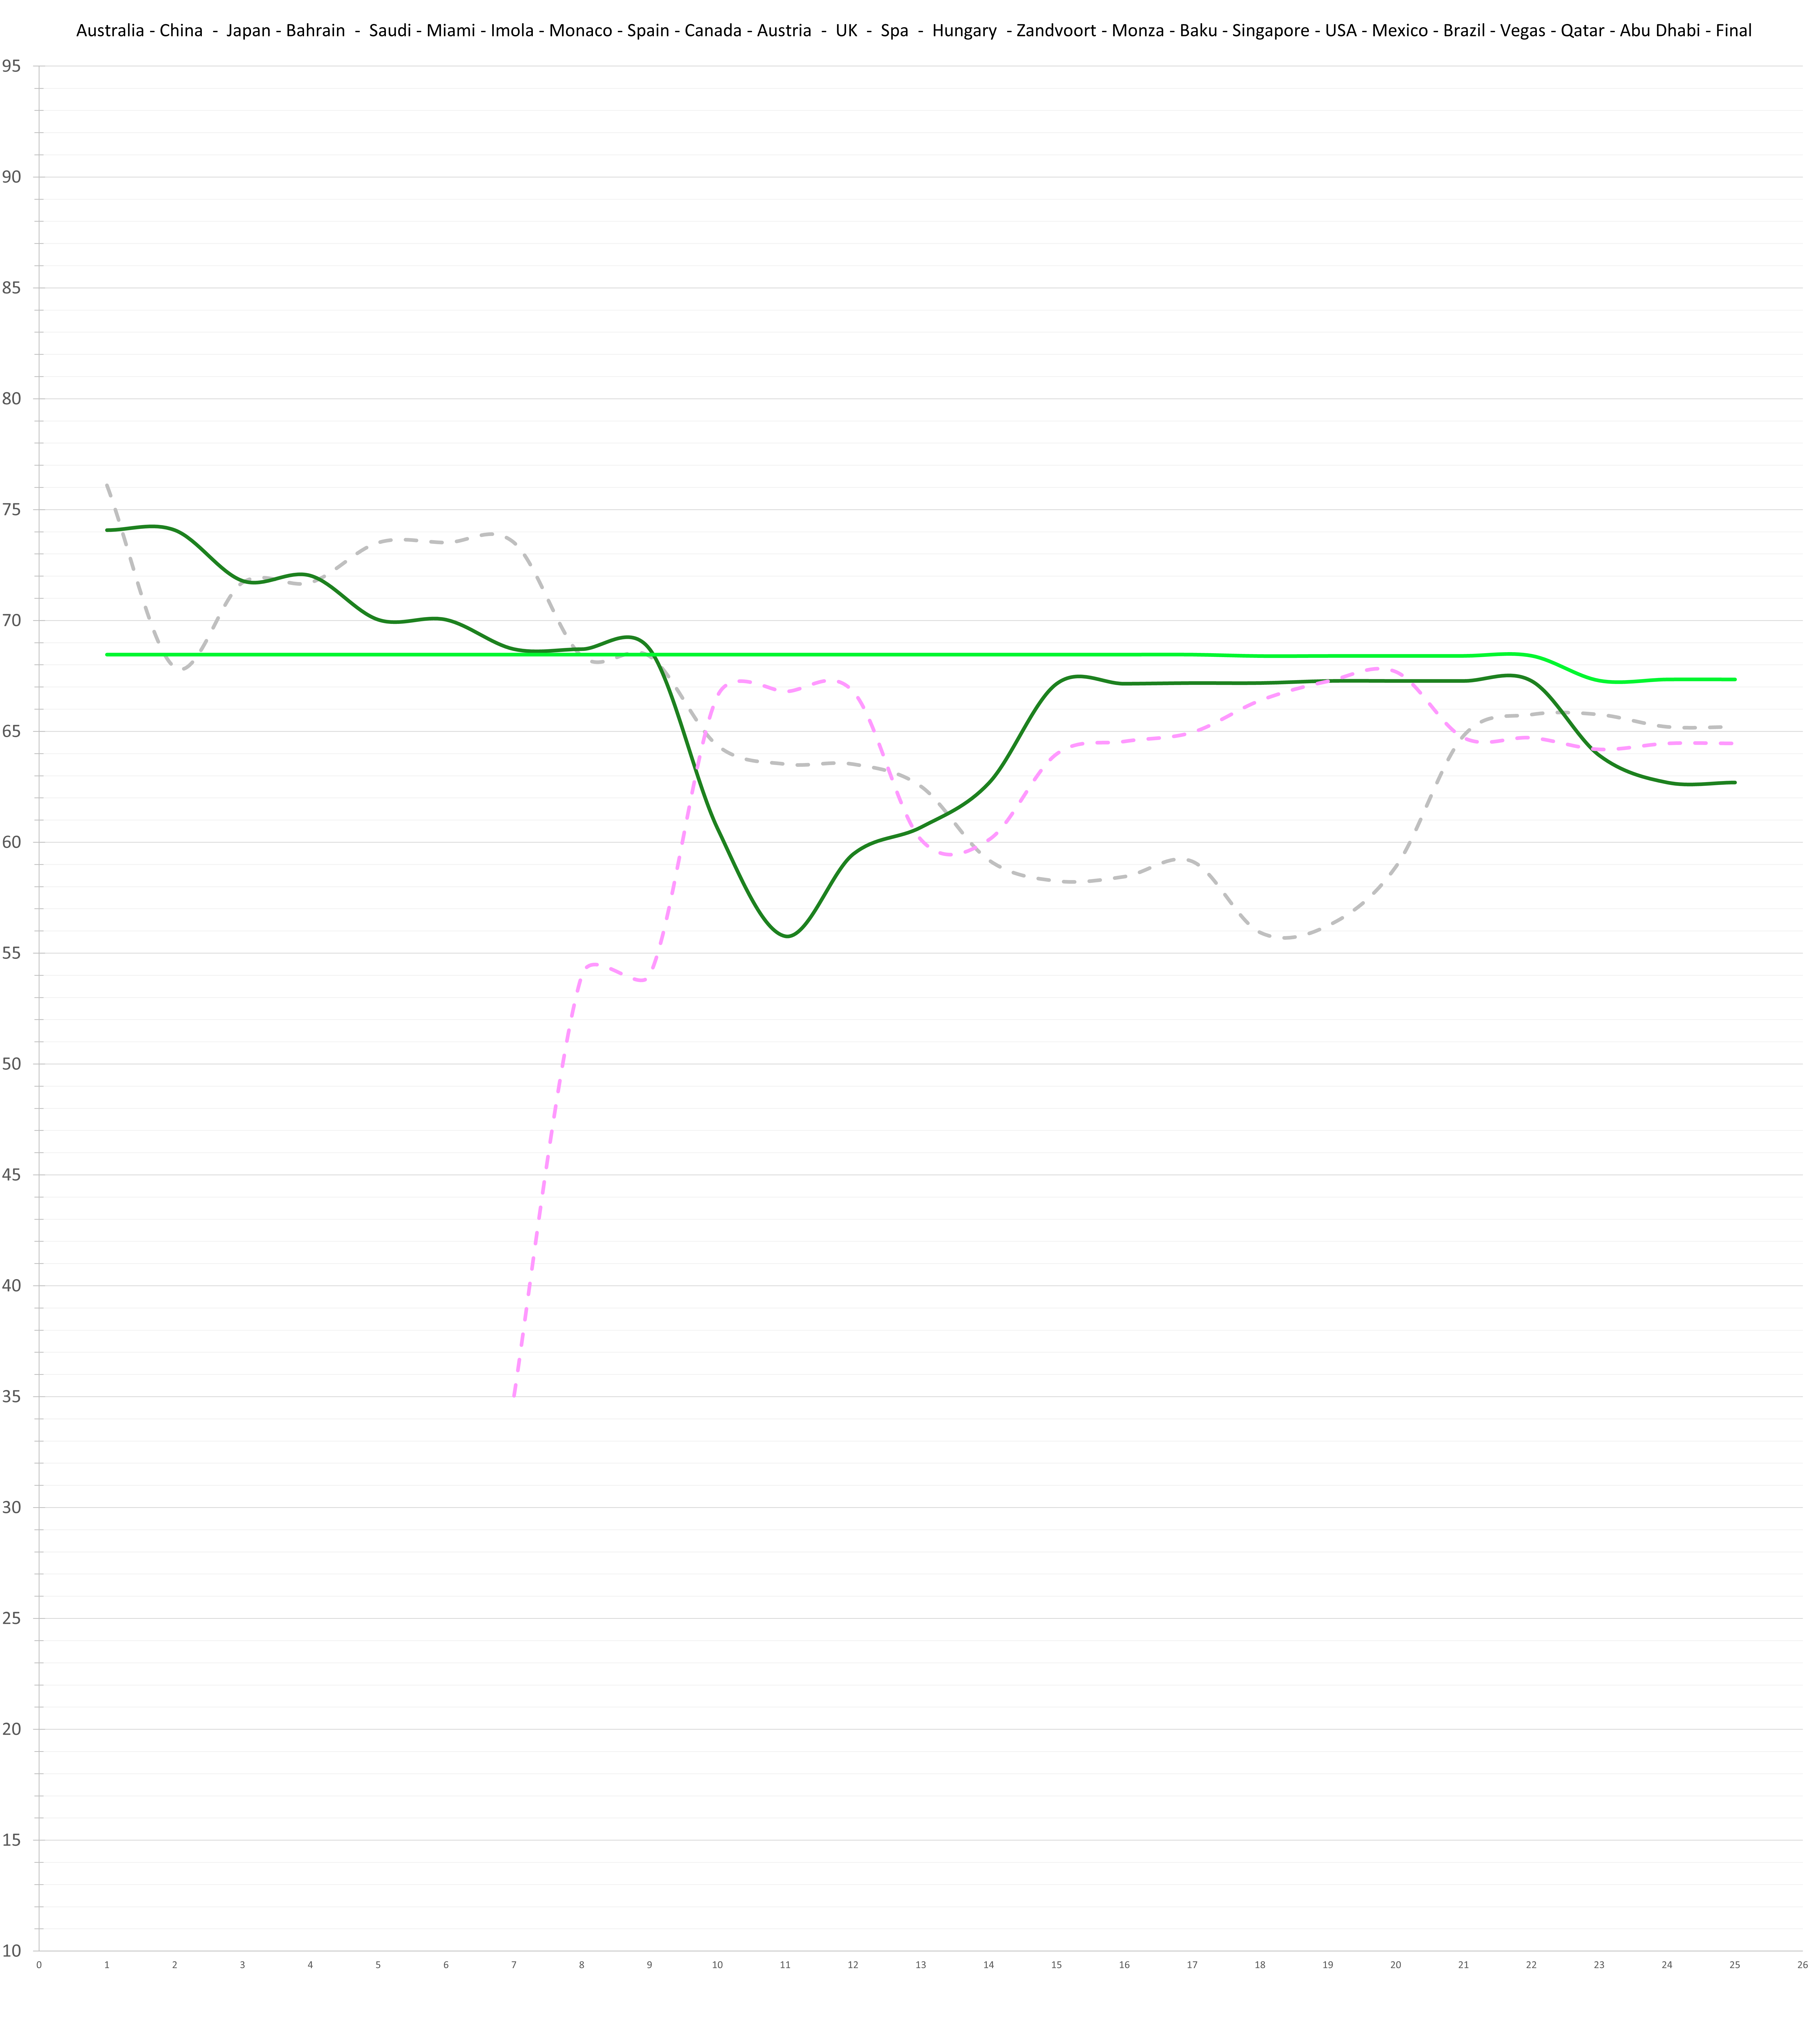
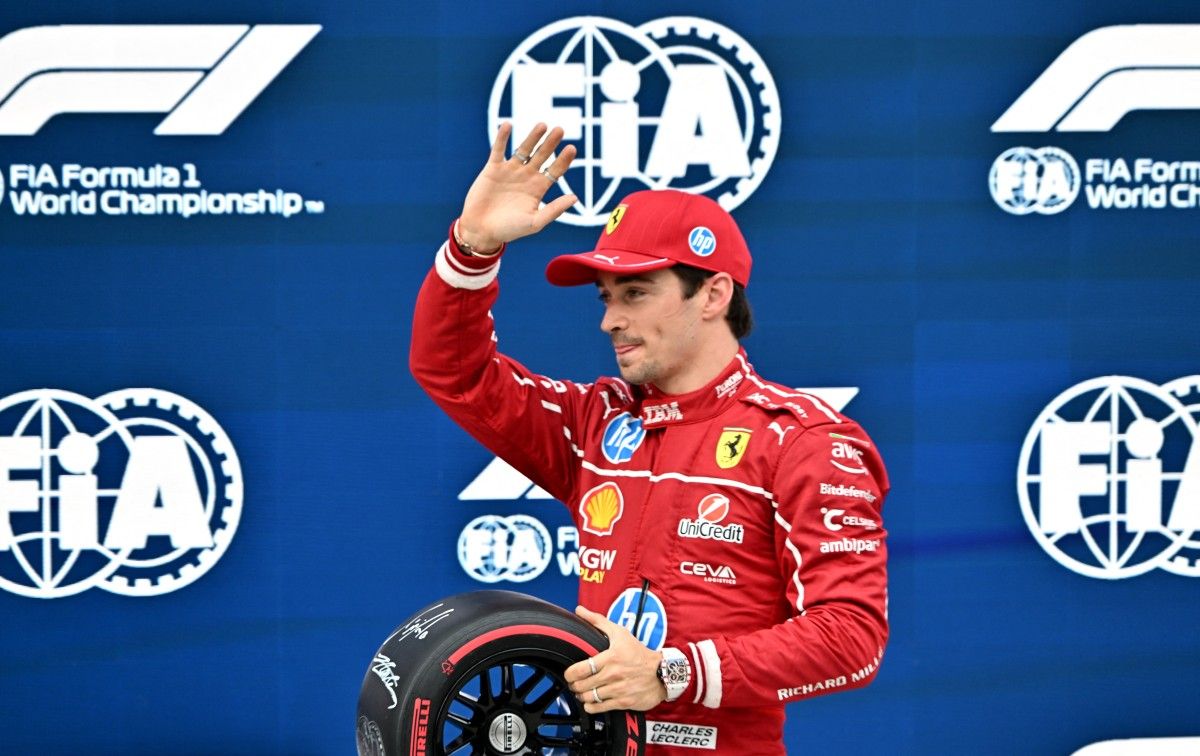
2 – Charles Leclerc – 90.2 (92.1)
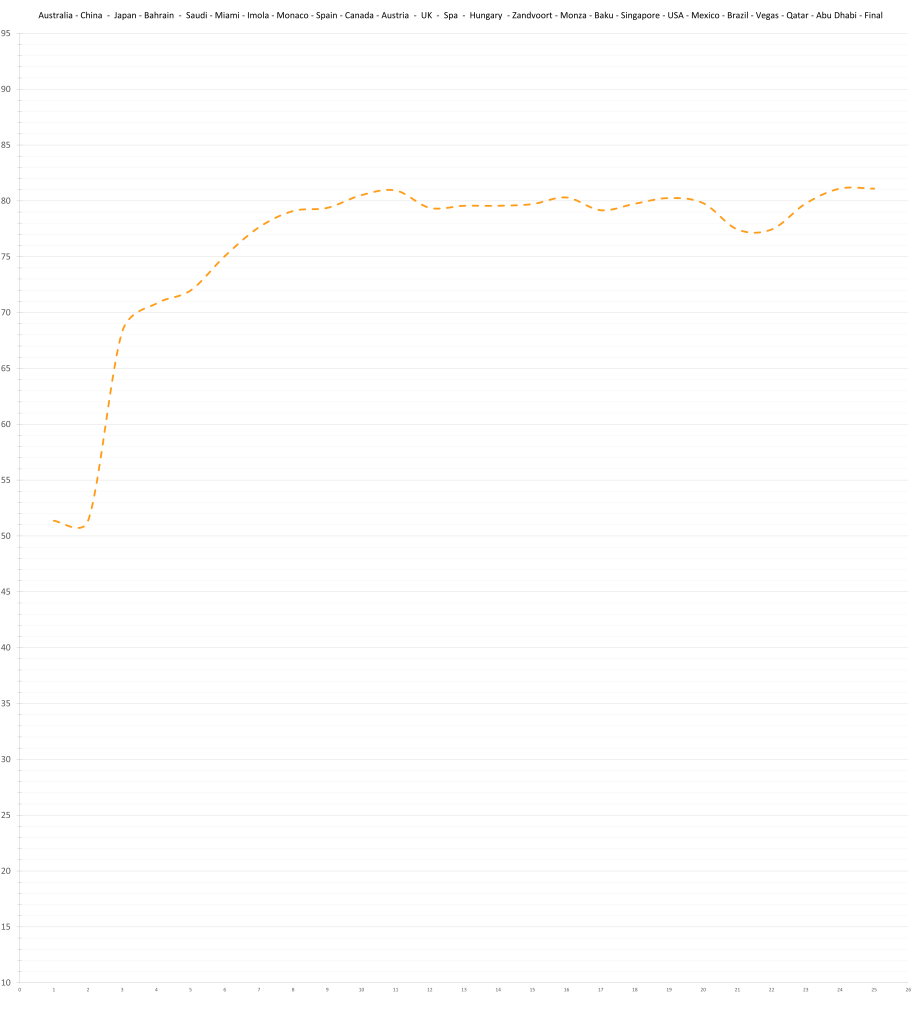
This combination of childhood rivals has been the 1-2 in every season since 2019 for the model, and they’re absolutely clear of the rest this year. Unfortunately for the Monegasque, it’s been the same order all the way through. However, Leclerc is getting his rating closer and closer (see below), and 2025 is a further step in that direction, as he managed to score above 90 for the first time. With 2025 done and setting new heights for Leclerc, his all-time rating is now 89.2, overtaking Niki Lauda to claim 8th in the ranking since 1969, and settling just behind Hamilton and Peterson.
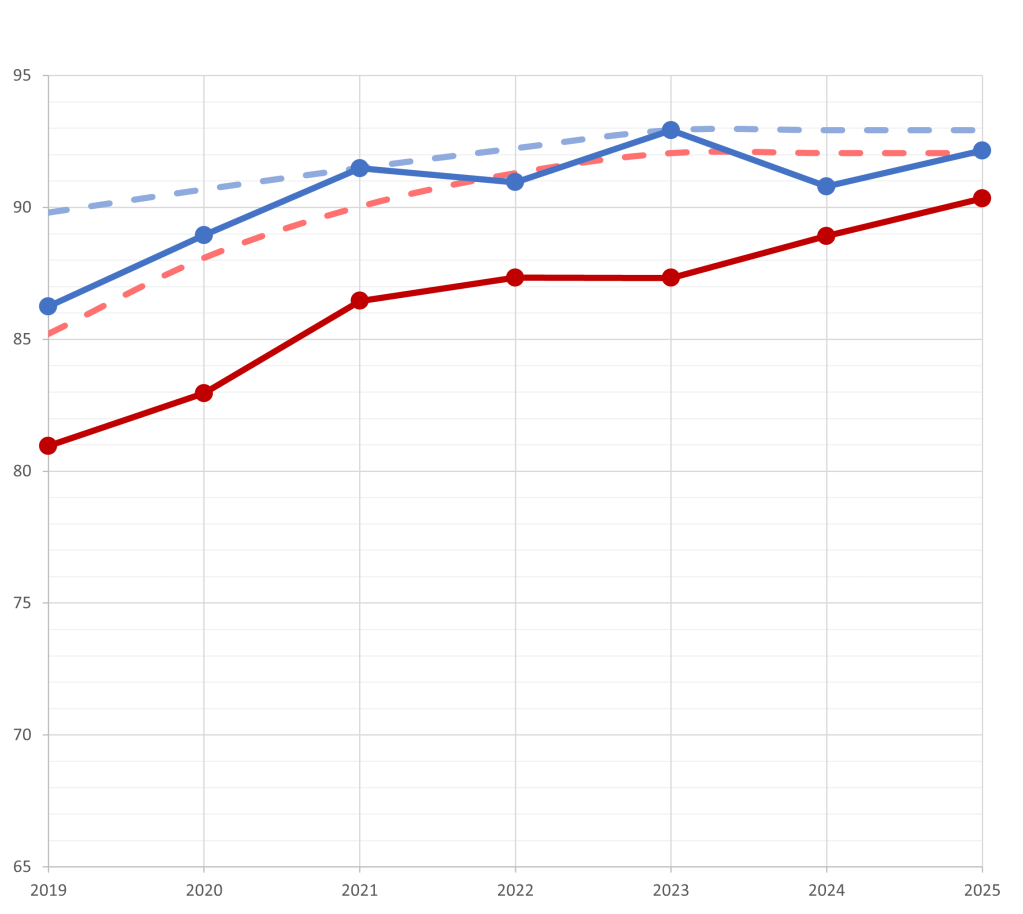
This diagram is showcasing something else too, though. Even this, which is Leclerc’s finest season ever, wouldn’t beat any of Verstappen’s last 5 seasons. Visible is the difference between an all-time great and a GOAT candidate; so close and yet so far.

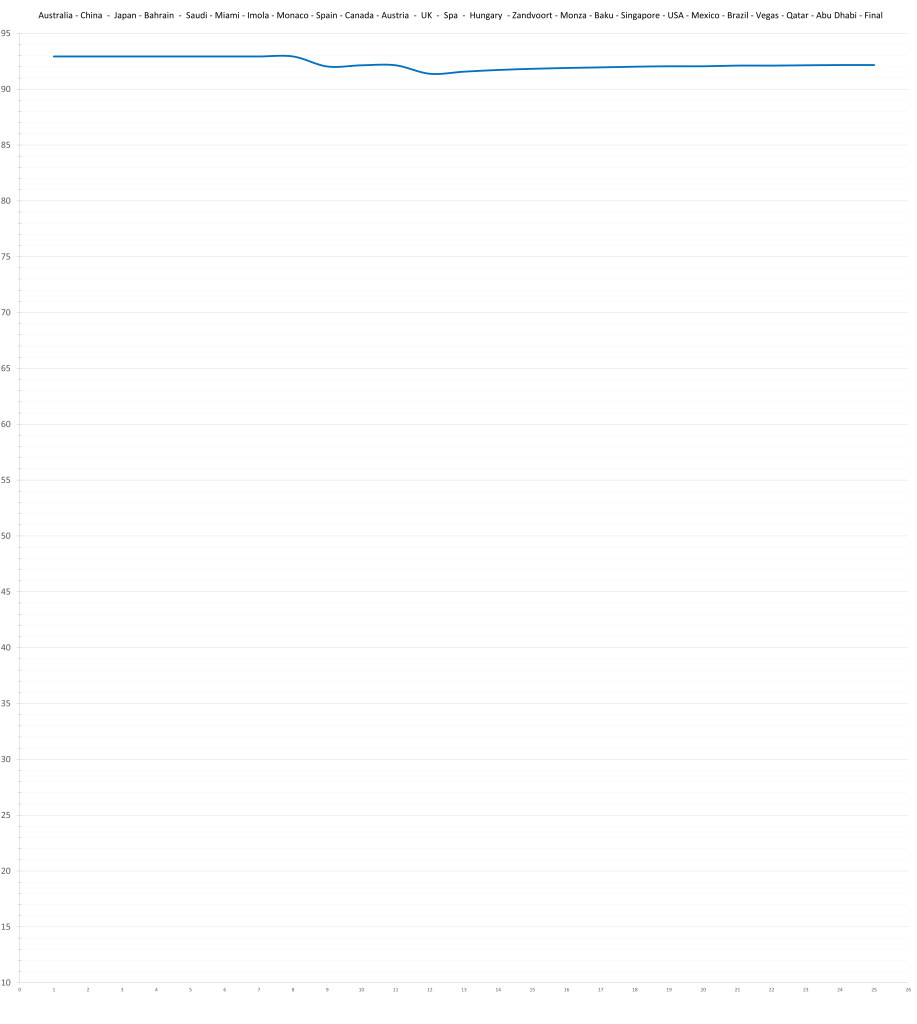
1 – Max Verstappen – 92.2 (92.9)

Boring. It’s a good thing Formula 1 isn’t a spec series because Max Verstappen is on a unique streak of 90+ performances since 2021. No other driver has held this high of a level this consistently, according to the model. In fairness, Schumacher was somewhat hindered by a broken leg; otherwise his 1996-2001 stretch might even eclipse Verstappen. Additionally, there is a very good chance that Jim Clark’s 1963-1967 were at least as good as Verstappen’s 2021-2025, but the 50s and 60s are not yet fully incorporated into the model.
2025 is Verstappen’s second highest rated season yet, and the 7th highest rated season in general since 1969. The ones in front exclusively belong to Senna, Schumacher, and of course Verstappen himself. With that, Verstappen’s overall rating (weighted average of top 4 seasons) now completely ties Senna’s at 92.3.
A Quick look At The Teams
- McLaren
- Red Bull
- Mercedes
- Racing Bulls
- Ferrari
- Sauber
- Williams
- Aston Martin
- Haas
- Alpine
McLaren were on their way to one of the most dominant cars of all time, and it’s wierd how that happened twice within 3 years and the same regulation cycle, with two different teams. However, from Monza to Abu Dhabi, Red Bull were borderline dominant themselves, eliminating a big part of McLaren’s advantage. Of course, part of that is the papaya outfits fallability in race management.
Behind them, Mercedes and Red Bull managed to seperate themselves from the midfield over the course of the season. Ferrari’s great driver line-up creates the illusion of being the worst frontrunner, when they really were barely at the top of the midfield. Sauber, after incredible in-season progress, are right there with them, and Racing Bulls’ rookies pair were genuinely enjoying one of the best cars on the grid. Williams on the other hand is flattered by it’s drivers, even though they clearly made a big step up from last year. And then there is Alpine, and they’re just as bad as they look.
According to the model, there were two outstanding driver pairings, with Ferrari (84.2) just snatching it from McLaren (83.2), but far ahead of Haas and Williams at 77. At the other side, Sauber (53.8), and Racing Bulls (53.9) have the lowest rated line-ups.

Leave a reply to victor Cancel reply